420
Views
8
CrossRef citations to date
0
Altmetric
Original Article

Kinetics of inflammatory markers following cancer-related bowel and liver resection

, , , , , , & show all
Pages 124-128 | Received 27 May 2010, Accepted 23 Aug 2010, Published online: 23 Nov 2010

Figures & data

Table I. Demographic data of patients and multiple organ dysfunction scores (MODS) in the two groups.

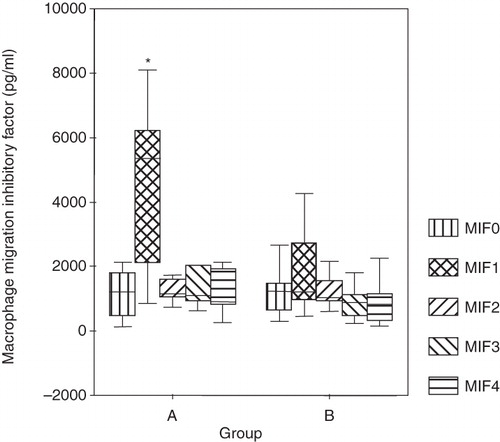
Table II. Macrophage migration inhibitory factor (MIF) values in the two groups.

Figure 1. Serum MIF levels preoperatively (MIF0), immediately postoperatively (MIF1), and on the three consecutive days (MIF2, MIF3, MIF4). The data were plotted as a ‘box plot’. The minimum–maximum and interquartile ranges are shown on the figure. The difference in the two groups was verified by the Mann-Whitney U test. *P < 0.006.

Figure 1. Serum MIF levels preoperatively (MIF0), immediately postoperatively (MIF1), and on the three consecutive days (MIF2, MIF3, MIF4). The data were plotted as a ‘box plot’. The minimum–maximum and interquartile ranges are shown on the figure. The difference in the two groups was verified by the Mann-Whitney U test. *P < 0.006.