Figures & data
Table I. Basic characteristics of subjects (mean ± standard deviation).
Figure 1. Measurements on short-axis magnetic resonance images were placed to correspond with measurements made on M-mode echocardiography and were used to calculate the left ventricular mass with the formula commonly used in echocardiography (LVMMRI/ASE). The end-diastolic inner left ventricular diameter (LVEDD) was measured from the middle of the inner aspect of the septal wall to the inner aspect of the posterior wall, and the interventricular septal thickness (IVS) and the posterior wall thickness (PW) were measured at the same level. To correspond with a parasternal short-axis M-mode view the image has to be turned 90 degrees clockwise.
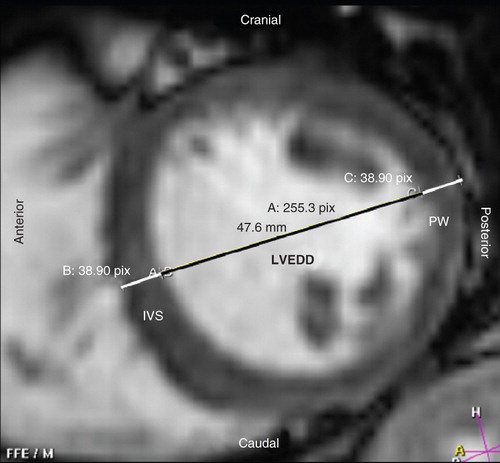
Table II. Left ventricular mass (mean ± standard deviation) in women, men, and the entire population calculated from measurements on MR images and echocardiography.
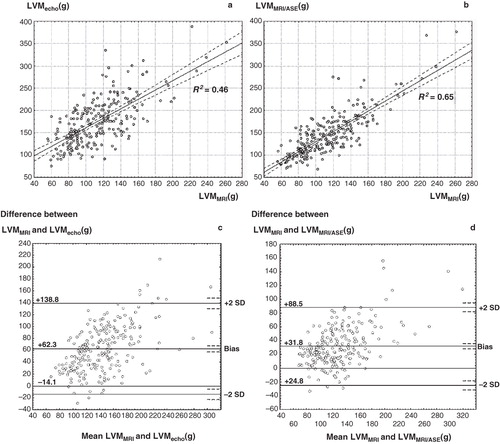
Figure 2. Regression analysis of left ventricular mass (LVM) estimates made with M-mode echocardiography (LVMecho) and with magnetic resonance imaging (LVMMRI) using standard techniques (A), and calculated with the echocardiography formula from echo-mimicking measurements made on MR images (LVMMRI/ASE)(B). Coefficients of determination are displayed in the diagrams. Bland–Altman plots displaying the agreement between the measurements of LVMMRI and LVMecho (C), and between the measurements of LVMMRI and LVMMRI/ASE (D).