Figures & data
Figure 1. Effects of dexmedetomidine (DEX; 20 μg/kg; i.p.) on morphine analgesia and tolerance in tail-flick (A) and hot-plate (B) tests. Each point represents the mean ± SEM of percent of maximal possible effect (% MPE) for 8 rats. *p < 0.05 compared to morphine group, **p < 0.01 compared to morphine-tolerant group.
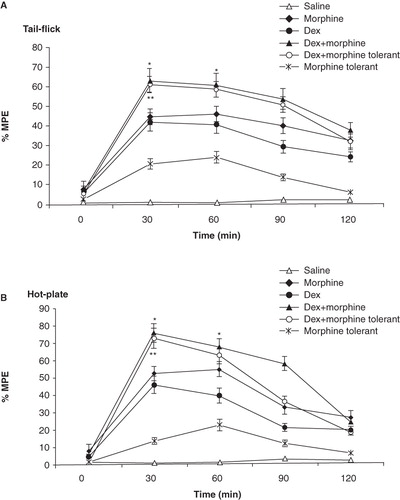
Figure 2. Effects of guanfacine (0.5 mg/kg; i.p.) on morphine analgesia and tolerance in tail-flick (A) and hot-plate (B) tests. Each point represents the mean ± SEM of percent of maximal possible effect (% MPE) for 7 rats. *p < 0.01 compared to saline group, **p < 0.05 compared to morphine-tolerant group.
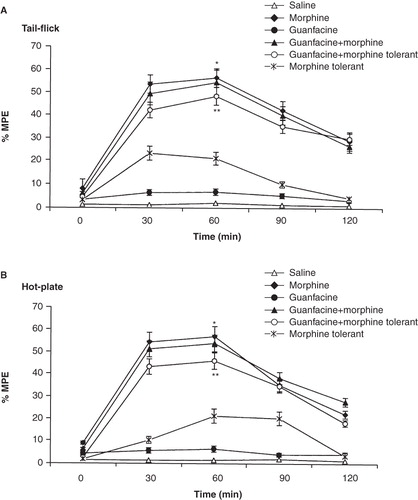
Figure 3. Effects of MK-467 (0.25 mg/kg; i.p.) on morphine analgesia and tolerance in tail-flick (A) and hot-plate (B) tests. Each point represents the mean ± SEM of percent of maximal possible effect (% MPE) for 7 rats. *p < 0.05 compared to MK-467 + morphine group, **p < 0.01 compared to MK-467 + morphine-tolerant group.
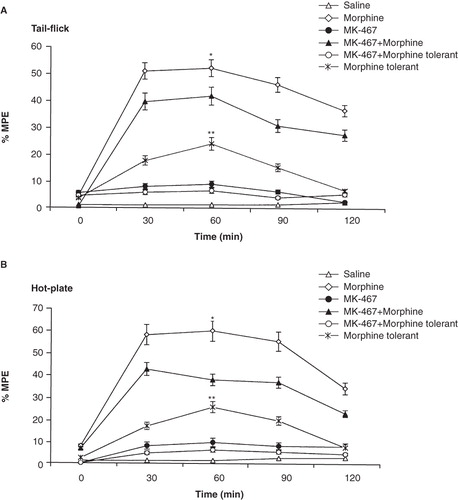
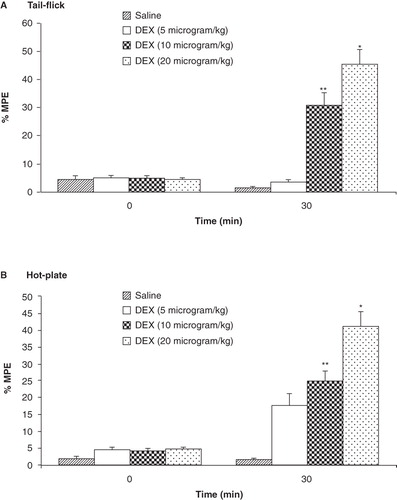
Figure 4. Analgesic effects of different doses of dexmedetomidine (5, 10, and 20 μg/kg; i.p.) as measured in tail-flick (A) and hot-plate (B) tests. Each point represents the mean ± SEM of percent of maximal possible effect (% MPE) for 8 rats. *p < 0.001, **p < 0.01 compared to saline-treated group.