Figures & data
Figure 1. Flow chart of the study population.
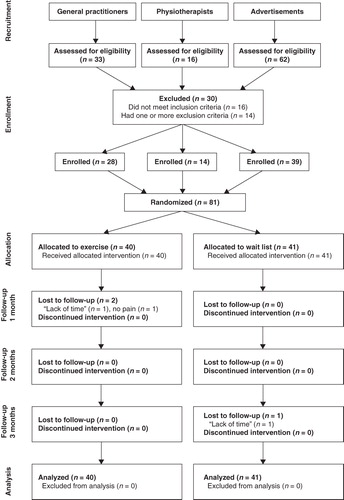
Figure 2. Photograph showing exercise set-up with the patient seated in an armchair with forearm support, holding the weight (a plastic container with a specified amount of water in it) in the affected arm, and performing exercise by lifting and lowering the container.
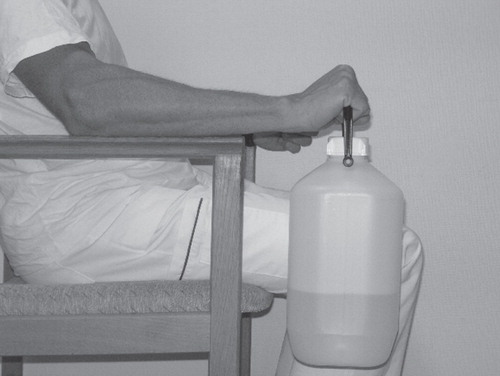
Figure 3. Cumulative proportion of responder analysis graph showing the proportions of subjects (vertical axis) that equal or exceed a specified improvement of pain during the 3-month treatment period (horizontal axis). The exercise group had higher responder rate at all levels of change in pain score during maximum voluntary contraction (A), as well as pain score during maximum muscle elongation (B).
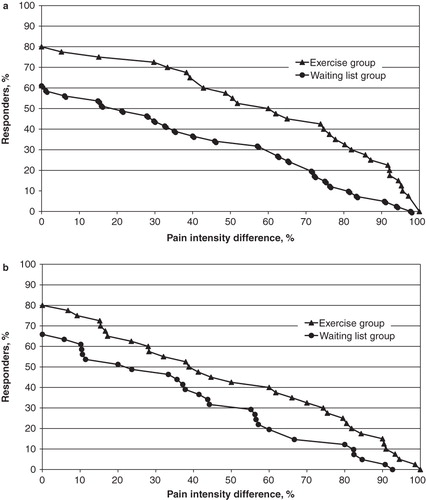
Table I. Characteristics of the study population.
Table II. Lateral elbow tendinosis history and previous treatments during the present episode.
Table III. Crude outcome data by measurement occasion and treatment group.