Figures & data
Table I. Demographic data in each group.
Figure 1. Changes in maternal HR, MAP, VAS scores, and fetal HR in each group. Values are expressed as mean ± SD. There was no significant difference between the two groups at any time points (p > 0.05).
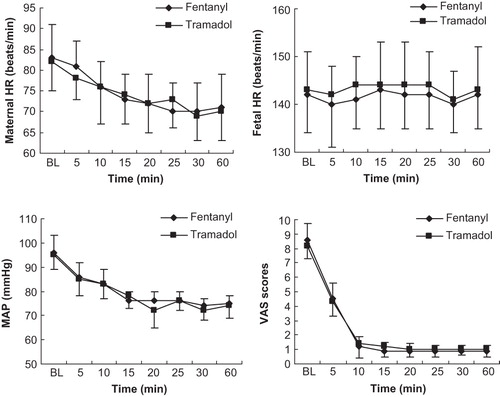
Table II. Maternal data in each group.
Table III. Neonatal data in each group.