Figures & data
Table I. Clinical characteristics of study participants presented for winter and summer seasons and coefficients of variation determined by the reliability study performed.
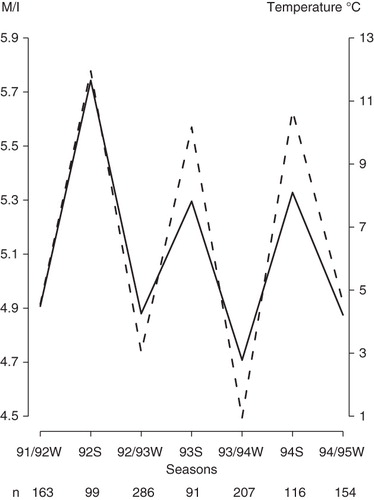
Figure 1. Mean values of insulin sensitivity index M/I (solid line) (100 × mg × min-1 × kg-1/(mU × L-1)) from a euglycemic insulin clamp, and outdoor temperature (dotted line) (degrees Celsius), versus winter (W) and summer (S) seasons of the year from the years 1991 to 1995. Outdoor temperature is the mean of observed outdoor temperatures of the month of the investigation and the 2 months preceding it.