Figures & data
Figure 1. Study population and subgroups 1990–2003.
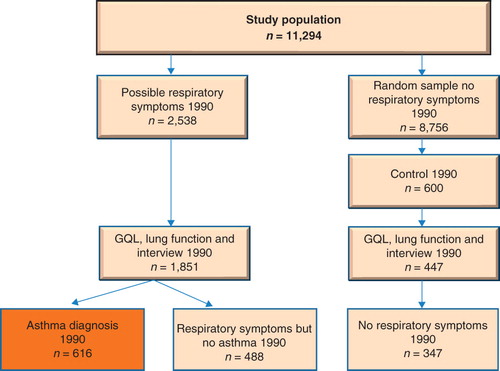
Table I. The characteristics of the study sample (n (%) and mean ± SD).
Table II. Determinants of asthma subjects. Multivariate linear regression, imputed data (n = 616). A negative value indicates lower quality of life. All coefficients for the score variables are per unit increase in the score unless noted otherwise.
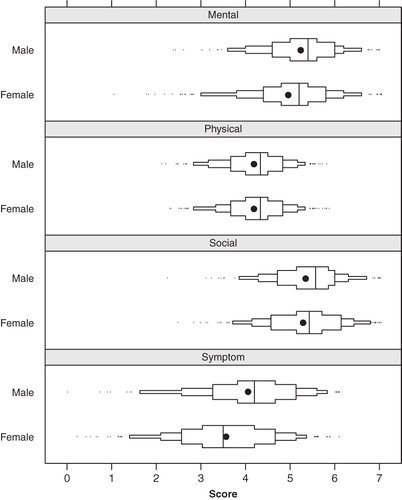
Figure 2. Distribution of the Gothenburg Quality of Life instrument subscales by sex. Solid dots indicate mean values, and solid line segments inside the boxes indicate the 25th, 50th, and 75th percentiles, respectively. Small ticks indicate observations outside the 5th and 95th percentiles. The x-axis represents the score on the seven-step Likert scale ranging from 1 = ‘very bad’, to 7 = ‘excellent/could not be better’.