Figures & data
Figure 1. Normal lung US finding in a longitudinal section.
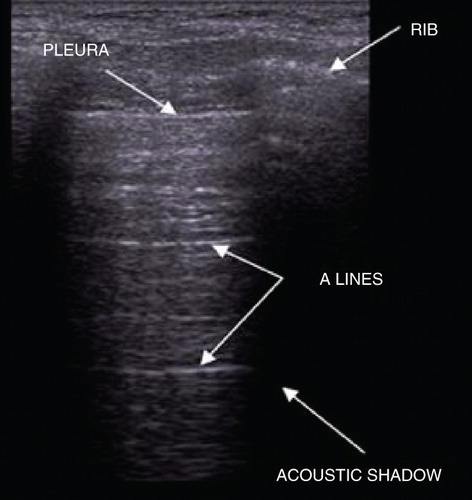
Figure 2. Dichotomous branching of the peripheral bronchioles within the subpleural consolidation.
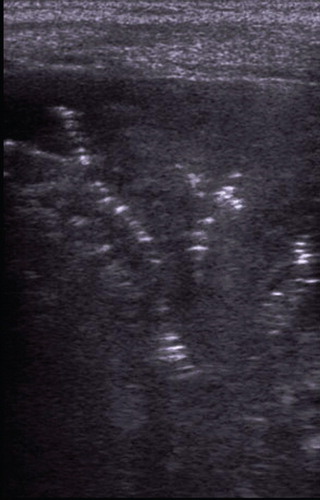
Figure 3. Two microabscesses (dotted arrows) with the greatest diameter of 7 mm.
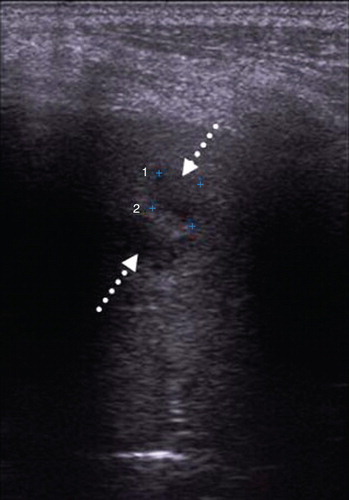
Figure 4. Parallel air bronchogram (arrows) within the pulmonary consolidation (C) of passive atelectasis due to large amount of pleural effusion (PE).
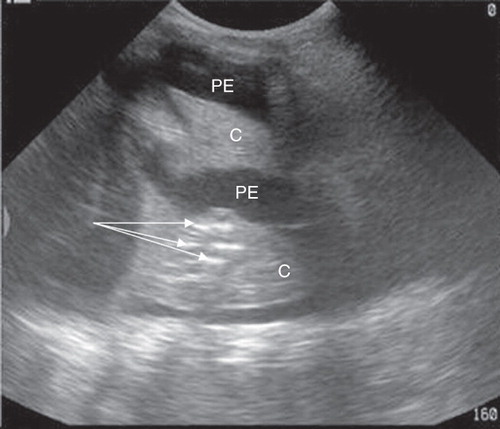
Figure 5. Four basic patterns of the lung US findings (IE = interstitial edema; AIE = alveolar-interstitial edema).
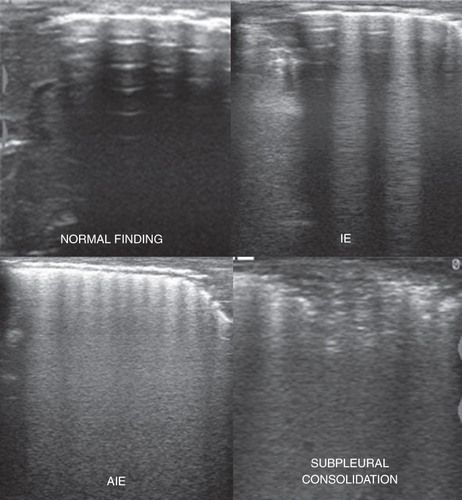
Figure 6. Examined lung areas in supine (A) and lateral decubitus (B) positions (H = transhepatic approach; S = transsplenic approach; Ar = anterior right, Al = anterior left, Lr = lateral right, Ll = lateral left, Pr = posterior right, and Pl = posterior left lung areas).
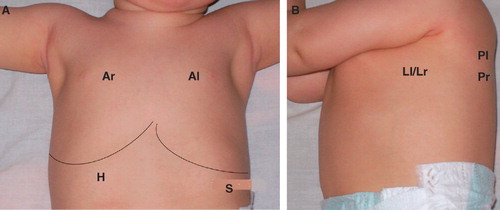
Figure 7. Inability of the US to differentiate between subpleural consolidations stemming from: pneumonia (left image), atelectasis (middle image), and hemorrhage (right image).
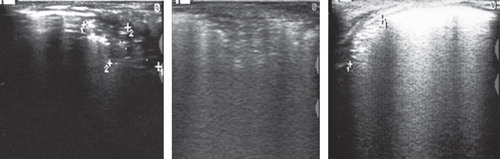
Table I. Distribution of different LUS findings in anterior and posterior lung areas of both hemithoraces, with evaluation of statistical significance.