Figures & data
Figure 1. Age distribution within the study group.
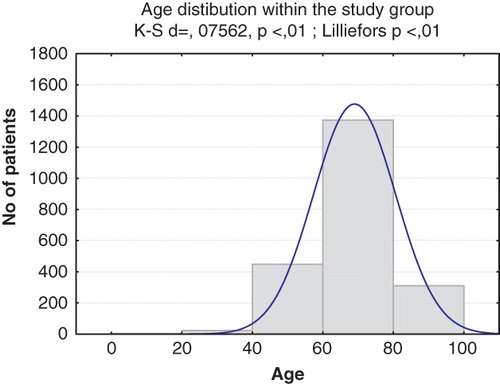
Figure 2. Sex distribution in the study groups.
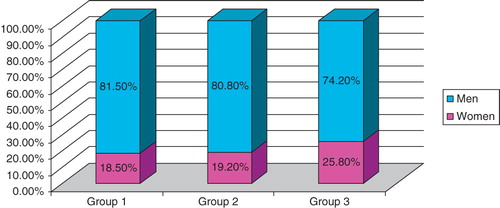
Table I. Comparison of analyzed parameters between different age groups.
Table II. Number and percentage of highly (G1), moderately (G2), and poorly (G3) differentiated tumors.
Figure 3. Tumor grades in the study groups.
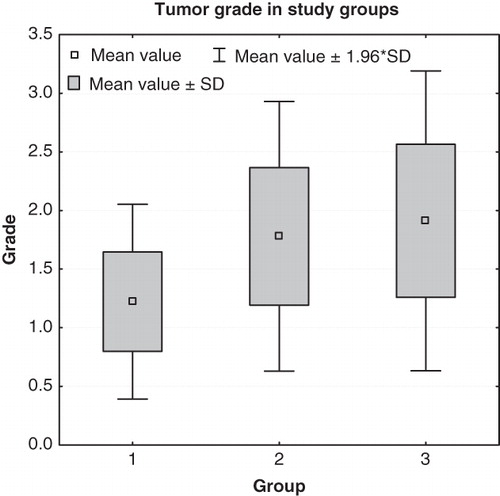
Table III. Stage of disease according to the TNM staging system.