Figures & data
Table I. Clinical characteristic of the study population.
Table II. Summarized results of CSF and serum tau protein concentrations and brain morphometric measurements of the study population.
Figure 1. CSF total-tau concentrations in different MS populations (box represents median with interquartile 25th–75th range; whiskers show 10th–90th percentile range; dots show values beyond defined percentiles). Mann–Whitney U P = 0.01. (CSF = cerebrospinal fluid; t-tau = total-tau; pg/mL = picograms per mL; RR = relapsing-remitting; SP = secondary progressive).
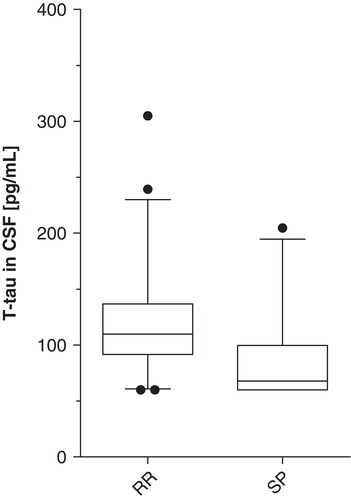
Figure 2. Negative correlation of t-tau with EDSS in the whole study population (y = –0.01x + 4.8) (linear regression line with 95% CI, R2 = 0.14, P = 0.04; Spearman R = –0.58, P = 0.0006). (EDSS = Expanded Disability Status Scale; t-tau = total-tau; pg/mL = picograms per mL).
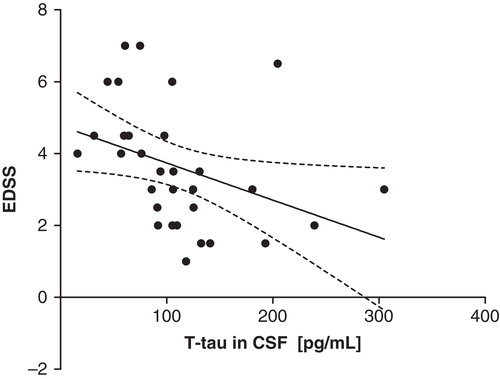
Figure 3. Negative correlation of EDSS with BPF in the whole study population (y = –25x + 25) (linear regression line with 95% CI, R2 = 0.26, P = 0.0002; Pearson R = –0.51, P = 0.0002). (BPF = brain parenchymal fraction; EDSS = Expanded Disability Status Scale).
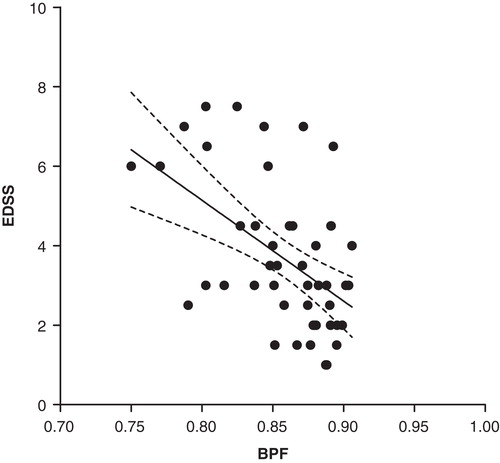
Figure 4. Negative correlation of MSSS and BPF in the whole study group (y = –25x + 27) (linear regression line with 95% CI, R2 = 0.18, P = 0.002; Pearson R = –0.42, P = 0.002). (MSSS = Multiple Sclerosis Severity Score; BPF = brain parenchymal fraction).
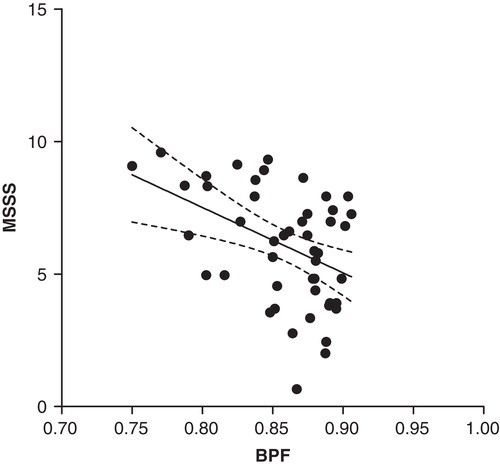
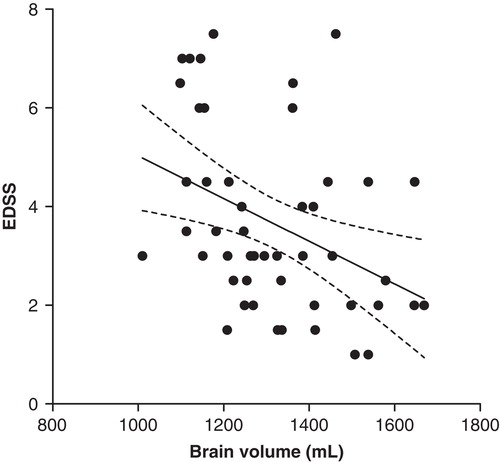
Figure 5. Negative correlation of brain volume with EDSS in the whole study population (y = –0.004x + 9.4) (linear regression line with 95% CI, R2 = 0.15, P = 0.007; Pearson R = –0.38, P = 0.007). (EDSS = Expanded Disability Status Scale).