Figures & data
Table I. Demographic and clinical data of the participants at admission.
Table II. Characteristics of all participants classified according to the quartile of CEM levels.
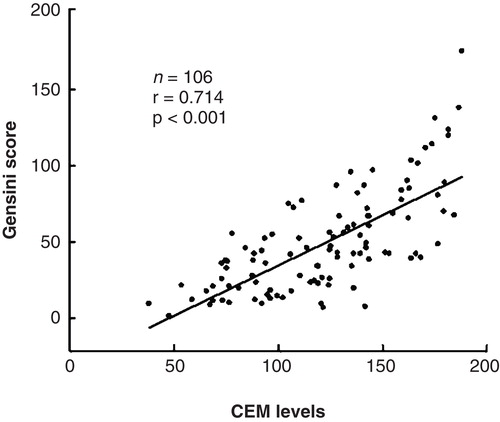
Figure 1. A: Gensini score in patients within different groups according to the quartile of CEM level. Horizontal line in the box plots represents the median value; the boxed area is the interquartile range, and the whiskers indicate minimum and maximum. B: CEM levels in controls and patients with stable angina pectoris (SAP), non-ST-segment elevation acute coronary syndrome (NSTEACS), and ST-segment elevation myocardial infarction (STEMI). CEM = total cholesterol content of erythrocyte membrane.
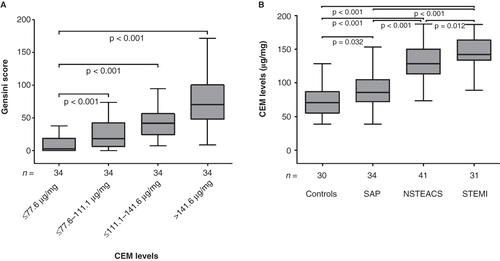
Figure 2. A: CEM levels in patients with coronary artery disease (CAD) on admission and at 6 months. B: The proportion of CEM reduction in patients in the low-dose group and high-dose group. ΔCEM = CEMadm − CEM6 months; adm = admission; CEM = total cholesterol content of erythrocyte membrane.
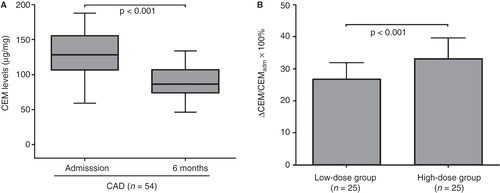
Figure 3. Correlation between CEM levels and coronary angiographic Gensini score in patients with coronary artery disease (CAD). CEM = total cholesterol content of erythrocyte membrane.