Figures & data
Table I. Disease-specific characteristics of patients with psoriasis vulgaris.
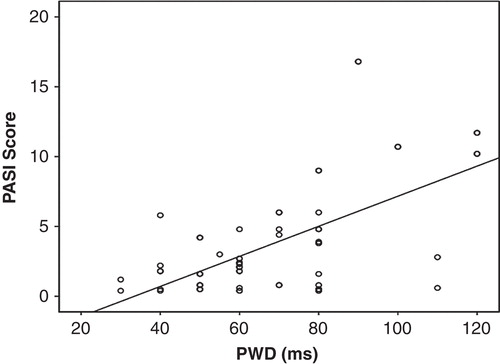
Figure 1. Bland–Altman plots demonstrating the 95% limits of agreement between (A) the repeated measurements of PWD by the same observer and (B) between the manual and digital measurements of PWD by two different observers, in 30 randomly selected patients.
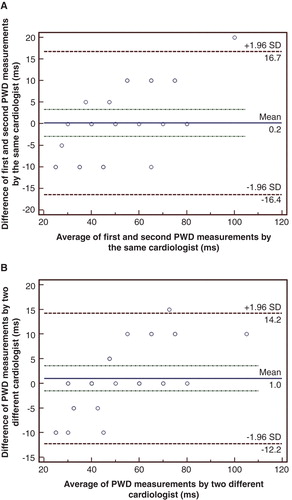
Table II. Demographic characteristics of the study population. Data were presented as mean ± standard deviation.
Table III. Echocardiographic measurements of study population. Data were presented as mean ± standard deviation.
Table IV. Comparison of P-wave values of the groups. Data were presented as mean ± standard deviation.
Figure 2. Scatter plot of the PASI score against PWD (ms) (r = 0.367, P = 0.005).