530
Views
3
CrossRef citations to date
0
Altmetric
Original Article

Predicting return to work among sickness-certified patients in general practice: Properties of two assessment tools

, &
Pages 268-277 | Received 11 Oct 2013, Accepted 05 May 2014, Published online: 30 May 2014

Figures & data

Figure 1. Nomograms showing proportion (%) returning to work on day 28 (a), 90 (b), and day 180 (c) from baseline. Age is attained age at baseline, sick-leave days during the last year are the total number of days of sick-leave, and ICD-10 diagnostic codes are the ICD-10 chapter codes F = psychiatric disease, G = nervous system disease, I = cardiovascular disease, K = gastrointestinal disease, M = musculoskeletal disease, A = infectious disease, B = parasite disease, O = obstetric disorders, L = dermatology disease, N = genitourinary system diseases, H = eye or ear disease, J = respiratory disease. The return to work probability is obtained by drawing a line connecting the actual age and the number of sick-leave days last year. Where the line crosses the bold vertical line in the middle of the nomogram, the return to work probability (%) is found by moving horizontally to the sick-leave diagnosis group. For example, the proportion returning to work within the first 28 days in a 54-year-old subject with 73 sick-leave days last year and an F diagnosis is approximately 38%, and 78% if the diagnosis was J. The corresponding proportions at day 90 are approximately 56% and 92%, respectively.

Figure 1. Nomograms showing proportion (%) returning to work on day 28 (a), 90 (b), and day 180 (c) from baseline. Age is attained age at baseline, sick-leave days during the last year are the total number of days of sick-leave, and ICD-10 diagnostic codes are the ICD-10 chapter codes F = psychiatric disease, G = nervous system disease, I = cardiovascular disease, K = gastrointestinal disease, M = musculoskeletal disease, A = infectious disease, B = parasite disease, O = obstetric disorders, L = dermatology disease, N = genitourinary system diseases, H = eye or ear disease, J = respiratory disease. The return to work probability is obtained by drawing a line connecting the actual age and the number of sick-leave days last year. Where the line crosses the bold vertical line in the middle of the nomogram, the return to work probability (%) is found by moving horizontally to the sick-leave diagnosis group. For example, the proportion returning to work within the first 28 days in a 54-year-old subject with 73 sick-leave days last year and an F diagnosis is approximately 38%, and 78% if the diagnosis was J. The corresponding proportions at day 90 are approximately 56% and 92%, respectively.

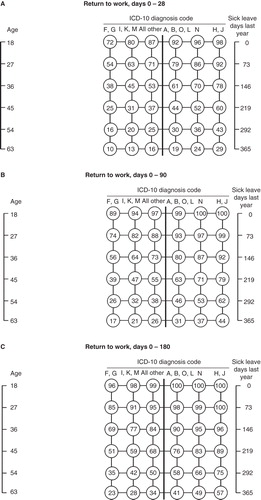
Table I. Characteristics of the study population.

Table II. Characteristics of the risk groups and effects of the risk grouping on return to work.

Table III. Effects of possible determinants on return to work during three time periods.