Figures & data
Figure 1. Expression of Bcl-2 in neo (B45) and bcl-2 (BMG)-transfected RINm5F cell clones and effects of palmitate and FCCP on B45 and BMG-transfected cell viability. A: Expression of Bcl-2 in BMG and B45 cell clones. B: Effects of palmitate and FCCP on B45 and BMG-transfected cell viability. RIN cell clones were incubated with 0.5 mM palmitate (0.5% BSA or 1% BSA + 1% FBS) or 1 μg/mL FCCP for 8 h. Results are means ± SEM for five separate experiments. * denotes p < 0.05 using paired Student’s t test when comparing versus corresponding control. C: One representative immunoblot showing Bcl-2 expression during the 8-h incubation with 0.5 mM palmitate (0.5% BSA). D: One representative immunoblot showing cleaved caspase 3 levels from five experiments. E: Mean optical density measurements of the immunoblots of cleaved caspase 3. The results are expressed as percentages of the control (B45 cells; Time zero) and shown as means ± SEM for five separate experiments. * denotes p < 0.05 using paired Student’s t test.
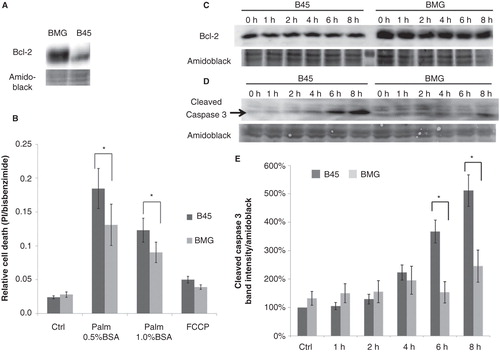
Figure 2. Effects of palmitate on GADD153 (CHOP) expression in B45 and BMG cells. RIN cell clones were incubated with 0.5 mM palmitate (0.5% BSA) for 8 h. A: Mean optical density measurements of the immunoblots of CHOP. Protein values were normalized to amido black staining of total protein. The results are expressed as percentages of the control (B45 cells; Time zero) and shown as means ± SEM. * denotes p < 0.05 using paired Student’s t test when comparing protein induction in BMG cells with corresponding B45 cells. B: One representative immunoblot of CHOP expression from five experiments is shown.
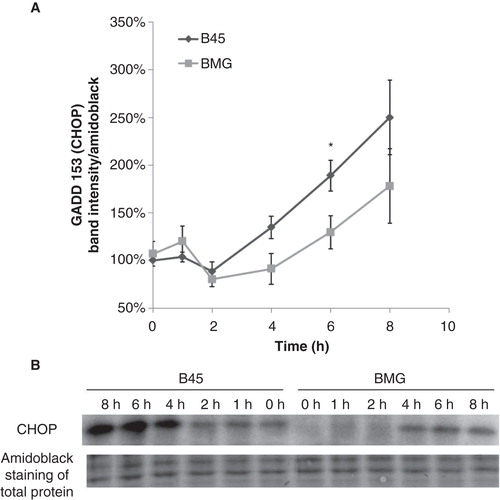
Figure 3. Effects of palmitate on ratio of BimEL upper to lower band intensity in B45 and BMG cells. Cell clones were incubated with cytokines (IL-1β 20 ng/mL and IFN-γ 20 ng/mL) for 1 h or 0.5 mM palmitate (0.5% BSA) for 2–8 h. After the treatments, the cells were lysed and analyzed by immunoblotting with anti-Bim antibody. BimEL is the longest splice form (23 kDa) of Bim. Two bands of BimEL were observed, and the upper band is probably the phosphorylated form of BimEL as verified by phosphatase treatment. A: Ratio of BimEL upper (phosphorylated) to lower (non-phosphorylated) bands. The results are expressed as percentages of the control (B45 cells; Time zero) and shown as means ± SEM. * denotes p < 0.05 and # denotes p < 0.01 when comparing BMG cells with corresponding B45 cells. B: One representative immunoblot of BimEL phosphorylation from four experiments is shown. C: One representative immunoblot of phosphatase treatment.
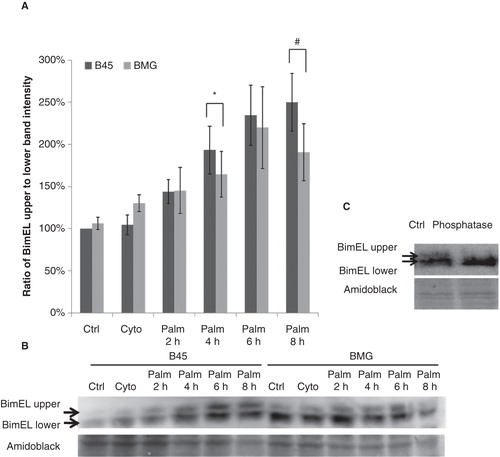
Figure 4. A: Effects of palmitate on JC-1 fluorescence in B45 and BMG cells. BMG and B45 cells were cultured for 1–8 h with 0.5 mM palmitate, 0.5% BSA. Data are expressed as the 585/530 nm fluorescence ratio normalized to the control of each time point. Results are means ± SEM for three separate experiments. # denotes p < 0.01 using paired Student’s t test when comparing uncoupling rate of BMG cells with corresponding B45 cells. The basal JC-1 fluorescence ratio at time zero is B45: 100 ± 5% and BMG: 86 ± 22%. B: Effects of palmitate on DCF fluorescence in B45 and BMG cells. BMG and B45 cells were cultured for 1, 2, or 3 h with 0.5 mM palmitate (0.5% BSA). Data are expressed as 530 nm fluorescence normalized to the control of each time point. Results are means ± SEM for three separate experiments. The basal signal of DCF fluorescence at time zero is B45: 100 ± 8%, and BMG: 97 ± 8%.
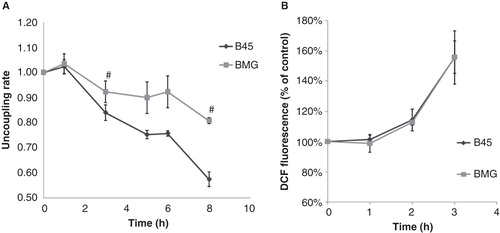
Figure 5. Effects of palmitate on phospho-IRE1α and phospho-eIF2α expression in B45 and BMG cells. RIN cell clones were incubated with 0.5 mM palmitate (0.5% BSA) for 6 or 8 h. Western blots were quantified, and protein values were normalized to amido black staining of total protein. Mean optical density measurements of the immunoblots for phospho-IRE1α (A) and phospho-eIF2α (C). The results are expressed as percentages of the control (B45 cells; Time zero) and shown as means ± SEM. B: One representative immunoblot of phospho-IRE1α expression from five experiments is shown. D: One representative immunoblot of phospho-eIF2α expression from six experiments is shown.
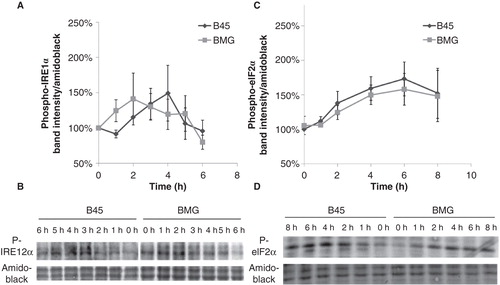
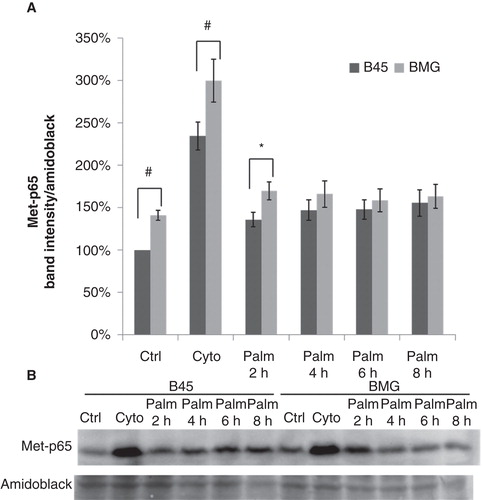
Figure 6. Effects of palmitate on Lys221-p65 methylation in B45 and BMG cells. Cell clones were incubated with cytokines (IL-1β 20 ng/mL and IFN-γ 20 ng/mL) for 1 h or 0.5 mM palmitate (0.5% BSA) for 2–8 h. After the treatments, the cells were lysed and analyzed by immunoblotting with anti-Methyl-Lys221-p65 antibody (Citation23). Immunoblots were quantified, and protein values were normalized to amido black staining of total protein. A: Cytokines and palmitate induced methylation of p65. The results are expressed as percentages of the control (B45 cells; Time zero) and shown as means ± SEM. * denotes p < 0.05 and # denotes p < 0.01 using paired Student’s t test when comparing BMG cells with corresponding B45 cells. B: One representative immunoblot of Lys221-p65 methylation from seven experiments is shown.