Figures & data
Figure 1. Schematic illustration of the rotating tubing bag whole-blood model. A. Multiple tubing bags attached to a rotating wheel in a 37°C cabinet using rubber bands. B. Tubing bags containing 1 mL of blood closed by sealing or a clip. C. A small hole left open for injections of additives (marked by an arrow).
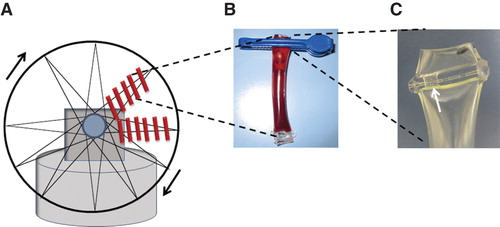
Figure 2. Glucose consumption in whole blood, with and without addition of exocrine tissue and thromboplastin. A. Glucose consumption during incubation of blood for 12 h; fresh venous blood with no glucose added (▾) or with glucose added at start up to 10 mmol L-1 (▪). Data presented as means ± SEM. B. Glucose concentration after 12 h (adjusted to 10 mmol L-1 at start) with and without addition of exocrine tissue or thromboplastin. Box plots represent the 25th to 75th percentiles and the median; whiskers show maximum and minimum values. P values derived from paired t tests.
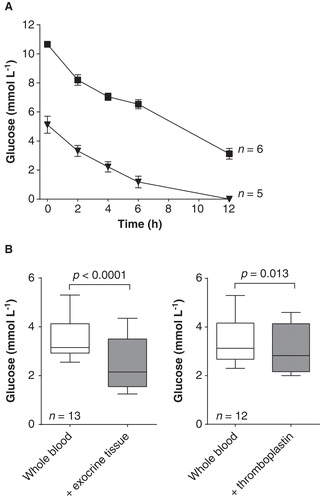
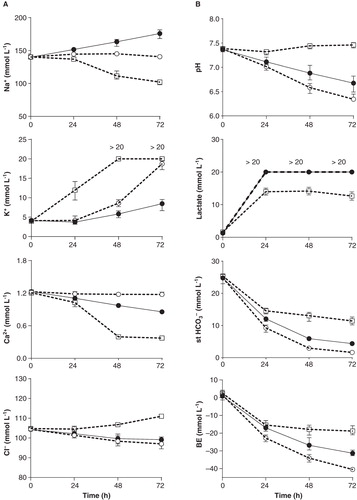
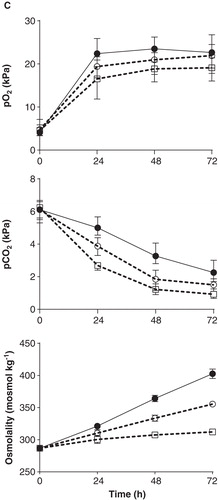
Table I. Blood gas analysis, including cations (Na+, K+, Ca2+) and anions (Cl–), and serum osmolality in whole blood at start and after 24, 48, and 72 h incubation with 12–15 μL of exocrine tissue. Glucose and NaHCO3 added every 12 h.
Figure 4. Viability and haemolysis (lactate dehydrogenase (LD) activity) in whole blood during incubation for 72 h. A. Viability of leukocytes measured as 7-AAD and PE annexin staining. Data presented as mean from three different experiments with or without addition of glucose and NaHCO3. Cells staining positive for 7-AAD represent late apoptosis or dead cells. Cells negative for 7-AAD but positive for PE annexin V represent early apoptosis. Cells negative for both 7-AAD and PE annexin V are viable. B. LD activity. Data presented as means from two different blood donors incubating whole blood only (□ dashed line) and whole blood with addition of glucose and NaHCO3 (• solid line).
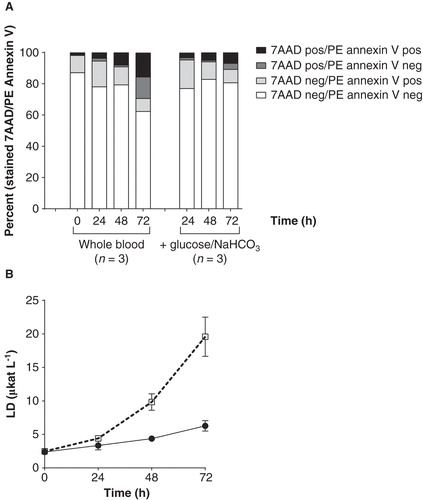
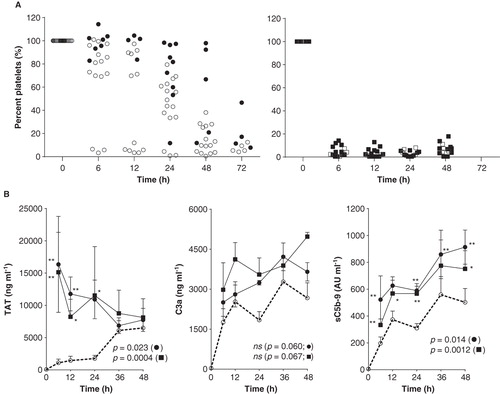
Figure 5. Coagulation and complement activation during incubation for 72 h. A. Platelet consumption as percentage (%) compared with the platelet count in venous blood at start. Treatment groups: whole blood only (•) and whole blood with addition of glucose and NaHCO3 during incubation (○) (left panel); whole blood with thromboplastin (▪) and collagen (□) added at start and then glucose and NaHCO3 at regular intervals during incubation (right panel). Data derived from 17 experiments, each dot representing one tubing bag. B. Coagulation and complement activation. Production of thrombin-antithrombin (TAT) complexes, C3a and sC5b-9 for control blood (○ dashed line) and with addition of thromboplastin (▪ solid line; n = 5) and collagen (• solid line; n = 3). All groups received addition of glucose and NaHCO3 during incubation. The effect of thromboplastin and collagen compared with control blood was evaluated with repeated measurement ANOVA and P values given in the figures for collagen (•) and thromboplastin (▪). Post hoc analysis presented as asterisks (*P < 0.05, **P < 0.01).