Figures & data
Table I. Characteristics of patients treated with hemodialysis, divided in two groups by concentration of dialysate potassium.
Table II. Hemodynamic parameters in patients treated with hemodialysis, divided in two groups by concentration of dialysate potassium.
Figure 1. Relative change of augmentation index in the two study groups (Group 1 = dialysate potassium 1 mmol/L; Group 2 = dialysate potassium 2 or 3 mmol/L) is presented using a boxplot with the square representing the 25th–75th percentile, the T-lines the 10th–90th percentile, and the circles representing observations <10th and >90th percentile.
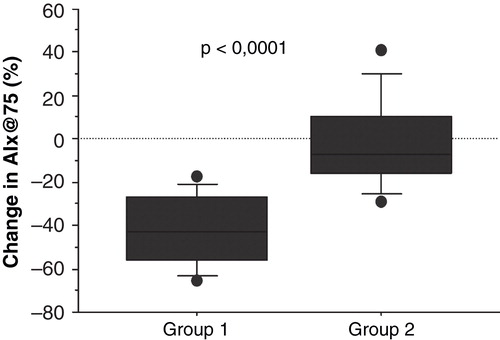
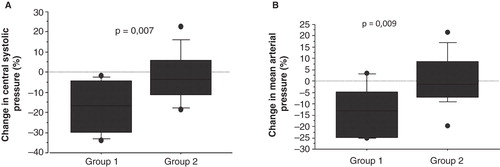
Figure 2. Boxplots of relative change of central systolic pressure and mean arterial pressure in the two study groups. A: Relative change of central systolic pressure. B: Relative change of mean arterial pressure. (Group 1 = dialysate potassium 1 mmol/L; Group 2 = dialysate potassium 2 or 3 mmol/L). The square represents the 25th–75th percentile, the T-lines the 10th–90th percentile, and the circles representing observations <10th and >90th percentile.