Figures & data
Figure 1. Schematic drawing of an infant maxillary dental cast with unilateral cleft lip and palate (UCLP). Landmarks and distances used in the linear measurements are demonstrated. D–E = cleft width at the level of the alveolar processes anteriorly; D–E1 = smallest cleft width at the level of the alveolar processes anteriorly; T–T1 = posterior width of the alveolar arch in the tuber area; A–A1 = width of the cleft at the level of T–T1; B–B1 = width of the cleft at the level of C–C1; B–B1/C–C1 = ratio of the cleft width related to the total alveolar arch width anteriorly at the level of the canine points; A–A1/T–T1 = ratio of the cleft width related to the total alveolar arch width posteriorly at the level of the tuberosity points.
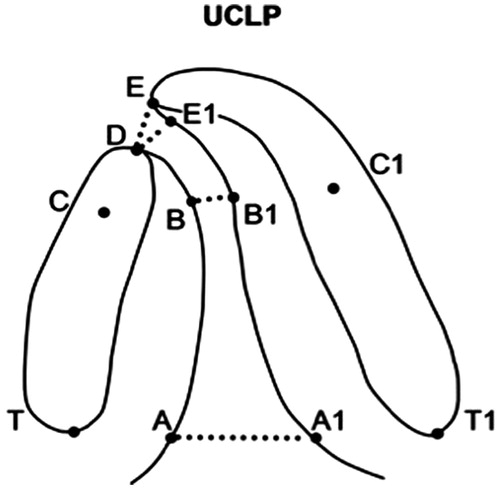
Table 1. Descriptive statistics with mean, standard deviation, minimum, median, and maximum for: cleft size measurements in millimeters (mm), cleft size ratios, degrees of dental anomalies, and modified Bergland Index.
Table 2. Spearman correlation between initial cleft width and alveolar bone height.
Figure 2. Enamel hypoplasia of the central incisor in the cleft area versus relative anterior cleft width (B–B ratio = B–B1/C–C1) as measured on dental casts obtained in connection to the primary lip plasty.
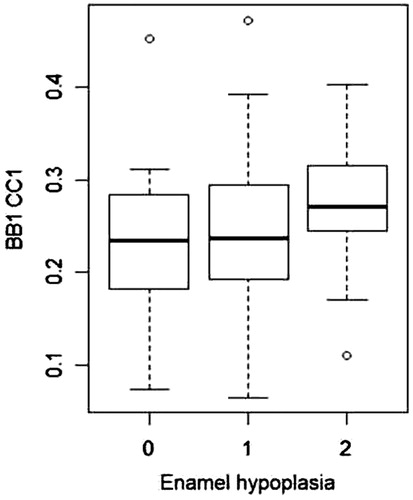
Figure 3. Rotation of the central incisor (degrees) in the cleft area versus relative anterior cleft width (B–B ratio = B–B1/C–C1) as measured on dental casts obtained in connection to the primary lip plasty.
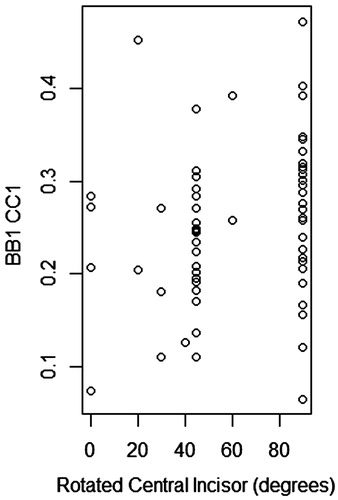
Figure 4. Rotation of the central incisor (degrees) in the cleft area versus cleft width at the level of the alveolar processes anteriorly D–E (mm).
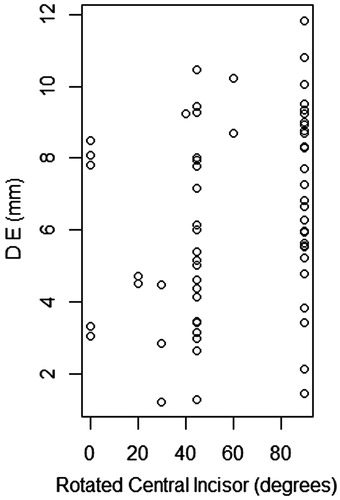
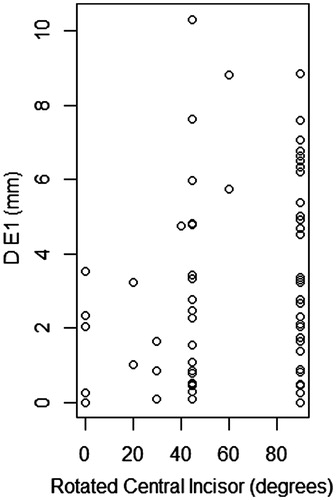
Figure 5. Rotation of the central incisor (degrees) in the cleft area versus smallest cleft width at the level of the alveolar processes anteriorly D–E1 (mm).