Figures & data
Figure 1 Study population. aTotal number of patients meeting the inclusion and exclusion criteria for the study. bDe novo staging according to SEER. cIdentification of distant recurrence according to Medicare claims. dTrastuzumab part of the first treatment regimen after diagnosis of metastatic breast cancer. eTrastuzumab part of second or subsequent treatment after diagnosis of metastatic breast cancer.
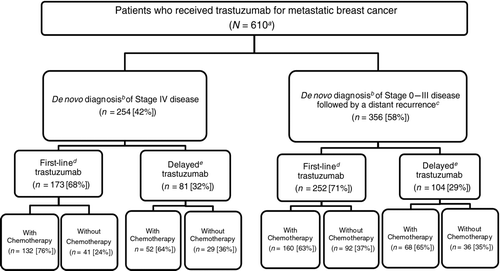
Table 1 Patient Characteristics
Table 2 Patterns of Trastuzumab use
Table 3 Trastuzumab Regimens
Figure 2 Patterns of trastuzumab use. Each row of data represents a single patient. Each colored rectangle within each row represents one month, ordered chronologically following the beginning of trastuzumab therapy, up to a maximum of 24 months. Dark blue rectangles indicate more administrations of trastuzumab in that month; light blue rectangles indicate fewer administrations; orange rectangles indicate no administrations of trastuzumab while the patient was still observed in the data set; and clear rectangles indicate that the patient was no longer observed in the data because of death or the end of the observation period. Within each of the four figures, patients are ordered from high (top of figure) to low number of trastuzumab administrations during 48 months following the beginning of therapy, a measure of both the intensity and duration of trastuzumab therapy. MBC—Metastatic breast cancer
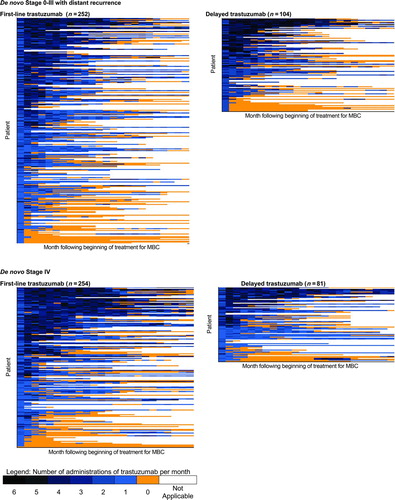
Table 4 Multivariate Survival Analysis-all Patients, by Cause of Death
Table 5 Multivariate Survival Analysis, Cancer Mortality Stratified by First-line Versus Delayed Trastuzumab
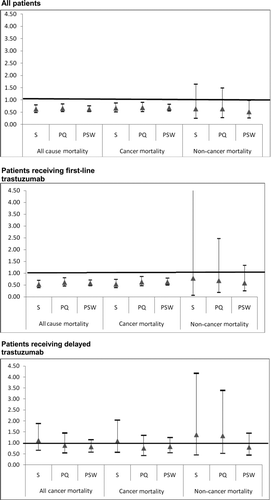
Figure 3 Sensitivity of trastuzumab hazard ratio to changes in the multivariate survival analysis. This figure presents the results of three sets (all patients, patients receiving first-line trastuzumab, patients receiving delayed trastuzumab) of nine multivariate survival analyses (three each for all-cause, cancer, and noncancer mortality) designed to test the sensitivity of the findings reported in Tables 4 and 5 to changes in the approach to multivariate analysis. Standard multivariate survival analyses (S) were performed with all individual patient variables included in the model. Propensity multivariate survival analyses were performed with either propensity score quintile (PQ) included in the model as a substitute for all patient variables except trastuzumab plus chemotherapy, or using propensity score as a weight (PSW). The y-axis indicates the hazard ratio for trastuzumab plus chemotherapy compared with trastuzumab alone. Triangles represent the estimated hazard ratio for trastuzumab plus chemotherapy compared with trastuzumab alone from the corresponding model on the x-axis. Bars around each triangle represent the upper and lower bounds of the 95% confidence interval for the hazard ratio. Confidence intervals that overlap the horizontal line at the hazard ratio of 1.0 indicate that the estimated hazard ratio for trastuzumab plus chemotherapy is not significant at p = .05.