Figures & data
Figure 1 Typical morphology and characterization of CAFs harvested from human EOC tissues. Typical CAF morphology: (A) spindle-shaped, (B) intermediate, and (C) flattened. Positive immunohistochemical staining for (D) α-SMA, (E) vimentin, and (F) FSP1, original magnification ×200.
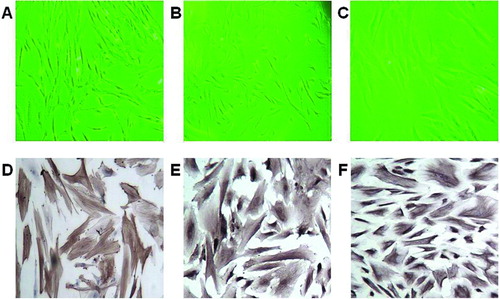
Figure 2 Effect of CC-CM on the proliferation, migration, and invasion of EOC cell lines. A: Proliferation of OVCAR-3 cells cultured in CC-CM or control medium. B: Proliferation of SKOV-3 cells cultured in CC-CM or control medium. C: Migration of OVCAR-3 and SKOV-3 cells cultured in CC-CM or control medium. D: Invasion of OVCAR-3 and SKOV-3 cells cultured in CC-CM or control medium. *p < .05.
Figure 3 Effect of CC-CM on serum deprivation–induced apoptosis of EOC cell lines. A and B: Flow cytometric analyses and quantification of serum deprivation–induced apoptosis in OVCAR-3 cells cultured in CC-CM or control medium. C and D: Flow cytometric analyses and quantification of serum deprivation–induced apoptosis in SKOV-3 cells cultured in CC-CM or control medium. *p < .05.
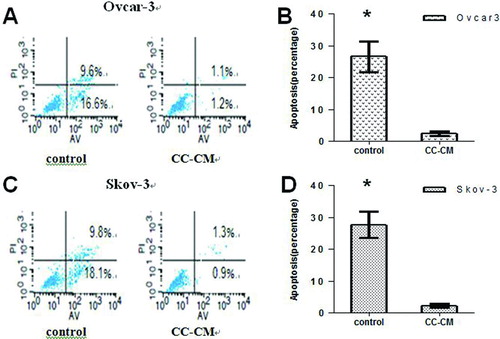
Figure 4 The interaction of CAFs with OVCAR-3 cells leads to increased levels of various cytokines (representative results, not of all 507 cytokines). The data are expressed as the fold induction ± s.d. of triplicates. There were significant expression of some cytokines, while the expression of large number other cytokines remained unchanged. Red column, OVCAR-3 cells only; green column, CAFs only; blue column, CAF+OVCAR-3 cells.
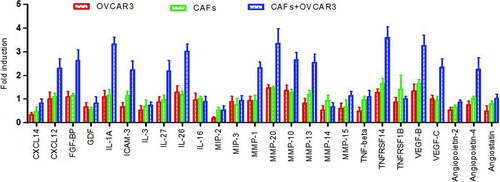
Table 1 Significantly Expressed* Cytokines in CAF and OVCAR-3 Cell CC-CM as Compared to OVCAR-3 cell CM