Figures & data
FIGURE 1. Flowchart summarizing data analysis workflow.
TABLE 1. LC-MS characteristics of identified, 24-h variant plasma metabolites and key parameters characterizing temporal variation
FIGURE 2. Time profiles of four plasma metabolites with different acrophases: (a) acetylcarnitine, (b) LysoPE(18:1), (c) proline, and (d) cortisol. On the horizontal axis, black bar indicates lights-off (0 lux) and white bar lights-on (440–825 lux). Internal standard (IS) shows the analytical variation of each ion in the pooled, replicate samples analyzed throughout the LC-MS run.
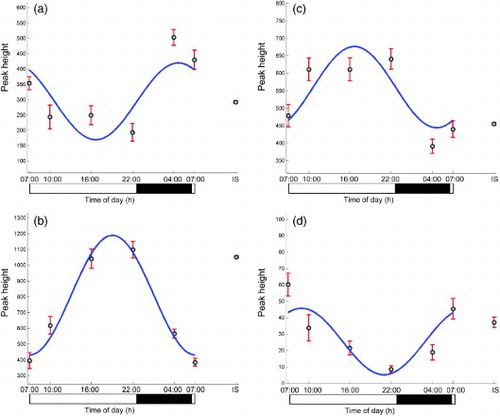
FIGURE 3. Plasma acetylcarnitine profiles for eight individuals maintained under controlled light/dark, sleep/wake, posture, and calorific intake conditions. Black bar indicates lights-off (0 lux) and white bar lights-on (440–825 lux).
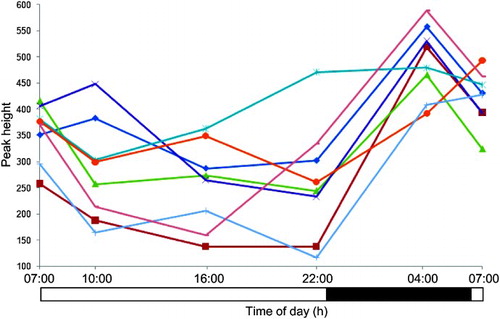
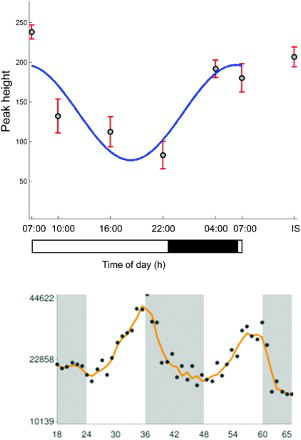
FIGURE 4. (Top panel) The temporal profile of palmitoylcarnitine in human plasma. (Bottom panel) CPT1a gene expression in a mouse model from an independent study (Hughes et al., Citation2009). Black/gray bars indicate lights-off and the white bar lights-on.
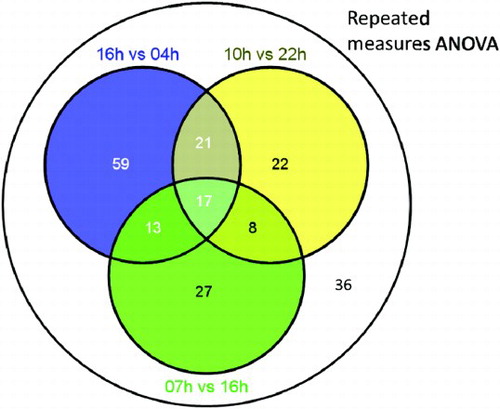
SUPPLEMENTARY FIGURE 1. Venn diagram showing overlapping sets of metabolite features detected by OPLS-DA of paired time points and repeated-measures ANOVA across all time points.
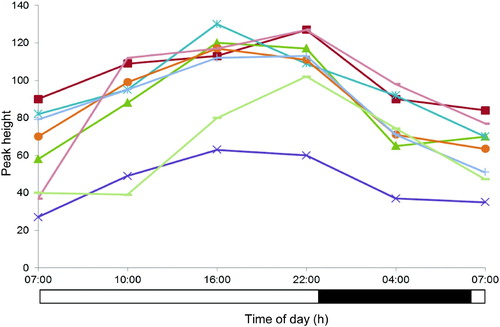
SUPPLEMENTARY FIGURE 2. Plasma profiles of metabolite feature with mass/charge 455.19 Da and retention time 5.7 min for eight individuals detected by repeated-measures ANOVA but not pairwise OPLS-DA comparisons, illustrating higher intersubject variability relative to intrasubject time-of-day variation. All participants were maintained under controlled light/dark, sleep/wake, posture, and calorific intake conditions. Black bar indicates lights-off (0 lux) and white bar lights-on (440–825 lux).
SUPPLEMENTARY TABLE 1. List of metabolite features detected in the screening process and considered for tandem MS
SUPPLEMENTARY TABLE 2. LC-MS features of metabolites of interest that did not exhibit significant 24-h variation (p > .05)