
Figures & data
Table 1. Demographics of the bipolar phenotype group and control group.
Figure 1. Representative examples of rest-activity patterns derived from 2 weeks’ wrist activity monitoring in control (upper panel) and bipolar phenotype (lower panel) female individuals. Actigraphic data are 48-h double plotted with successive days on vertical axis. Midline indicates midnight between day 1 and day 2. Edited data are highlighted with “___”.
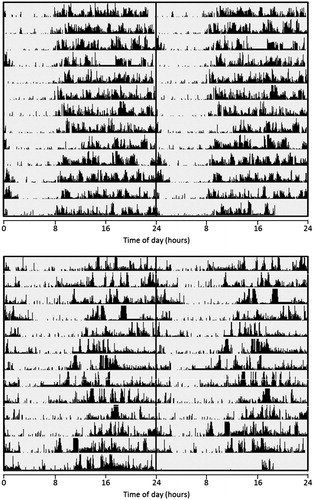
Table 2. Parameters of sleep–wake activity in the bipolar phenotype group and control group.
Table 3. Parameters of circadian rhythms in activity in the bipolar phenotype group and control group.