Figures & data
Table I. Characteristics of the study group (n = 163).
Table II. Differences of clinical factors in univariate analyses between two outcome groups.
Figure 1. Receiver operating characteristic (ROC) curve showing the cord blood concentration of CCL18 in prediction of the risk of intraventricular hemorrhage grade II–IV. Low level of CCL18 in cord blood (cut-off value 4969 fluorescence units) predicted IVH in very preterm infants with a sensitivity of 74% and a specificity of 73% (area under ROC curve 0.72, P=0.002).
Table III. A multiple logistic regression model shows independent risk factors of IVH grade II–IV.
Table IV. A multiple logistic regression model shows independent risk factors of early IVH grade II–IV.
Table V. Analysis of plasma concentrations of CCL18 (pg/mL) from very preterm infants with IVH grade II–IV and no IVH or IVH grade I using enzyme-linked immunosorbent assay.
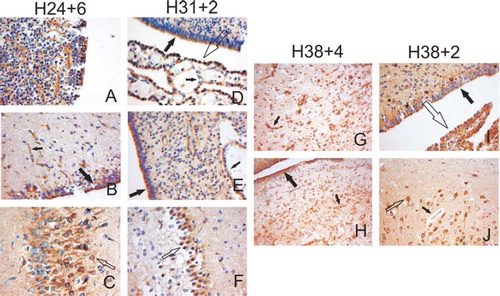
Figure 2. Immunohistochemical localization of CCR3 in the brain. Representative brain samples from preterm (A–F) and term (G–J) infants from different gestational weeks as indicated were stained with anti-CCR3 antibodies. Panel A shows the positive staining in the germinal matrix. Big black arrows indicate the staining in the ependymal cells, small black arrows in the endothelium of the capillaries, small open arrows in the neurons of the hippocampus, and big open arrows in the choroid plexus. Panels G and H represent samples from an infant with long-term asphyxia with remarkable capillary proliferation and an intense CCR3 staining of the endothelia. Panels I and J represent samples from an infant who died from an acute asphyxia. Original magnification in all figures is ×200.