Figures & data
Figure 1. Meijer's arc.
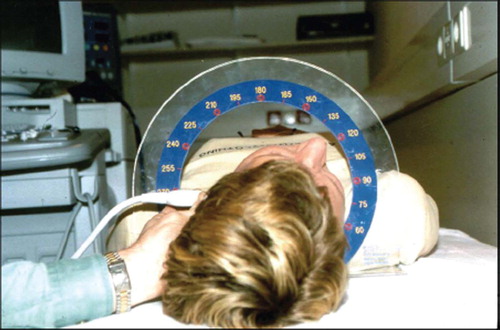
Table I. The 60 different ultrasound protocols constructed using the study data on segments, walls, and angles measured.
Table II. Base-line characteristics of the RADIANCE 1 and RADIANCE 2 study populations. Values presented as mean (standard deviation) or number (percentage).
Table III. Reproducibility of CIMT measurements at base-line in the RADIANCE 1 study (n=748), estimated as intra-class correlation coefficients (ICC) and the mean difference in CIMT (mm) between duplicate scans. Protocols were ranked in an order of low to high reproducibility (increasing ICC and decreasing standard deviation of mean difference): the higher the rank, the better the protocol. Ranking ICC for all protocols (reported for CCA the top 4; for MeanMax the top 8, and for all the top 10). Please see for precise information on the angles used in each protocol.
Table IV. Left side: Annual rate of progression of CIMT (mm), its precision (standard errors), absolute ratio of progression/precision and ranking of the ratio for all 60 ultrasound protocols in the RADIANCE 1 study for the atorvastatin only group (n=364). Right side: Effect of treatment on CIMT rate of progression over time in RADIANCE 1 (n=748). Regression coefficients represent the increase in CIMT per year due to treatment with torcetrapib. Protocols were ranked in an order from low to high: the higher the rank, the better the protocol. Ranking reported for CCA the top 4; for MeanMax the top 8, and for all the top 10. Please see for precise information on the angles used in each protocol.
Table V. Reproducibility of CIMT measurements at base-line in the RADIANCE 2 study (n=521), estimated as intra-class correlation coefficients (ICC) and the mean difference in CIMT (mm) between duplicate scans and ranking for all protocols. Protocols were ranked in an order of low to high reproducibility (increasing ICC and decreasing standard deviation of mean difference): the higher the rank, the better the protocol. Ranking ICC for all protocols reported for CCA the top 4; for MeanMax the top 8 and for all the top 10. Please see for precise information on the angles used in each protocol.
Table VI. Left side: Annual rate of progression of CIMT (mm), its precision (standard errors), absolute ratio of progression/precision and ranking of the ratio for all 60 ultrasound protocols in the RADIANCE 2 study for the atorvastatin only group (n = 268). Right side: Effect of treatment on CIMT rate of progression over time in RADIANCE 2 (n = 521). Regression coefficients represent the increase in CIMT per year due to treatment with torcetrapib. Protocols were ranked in an order from low to high: the higher the rank, the better the protocol. Please see for precise information on the angles used in each protocol. Ranking for all protocols (for CCA top 4; for MeanMax top 8 and for all the top 10).
Table VII. Overall ranking of the ultrasound protocols based on summation of the transformed rank scores (mean common CIMT and mean maximum CIMT into quintile scores; overall rank scores into sixtile scores) for the RADIANCE 1 and RADIANCE 2 study. Ranking for all protocols (for CCA top 4; for MeanMax top 8, and for all the top 10).