Figures & data
Figure 1. The flow chart shows how participants in the CLUE I and CLUE II surveys were selected for inclusion in this study.
Table IA. Demographic and clinical data of subjects receiving a diagnosis of CD in the CLUE 1 and/or CLUE 2 studies.
Figure 2. Results of the celiac screening of the 3,511 matched participating subjects. *Only 15 of the 16 CD autoimmunity subjects tested EMA-positive at CLUE II as 1 subject was on a gluten-free diet (, case 6).
Figure 3. A: IgA anti-tTG levels in CD cases participating in CLUE I (1974) and CLUE II (1989) studies. One subject with high IgA anti-tTG only at CLUE I (, case 6) was diagnosed with CD between CLUE I and CLUE II, and was on a gluten-free diet at CLUE II (solid line). B: Antibody levels in not-CD subjects with isolated IgA anti-tTG positivity at CLUE I (1974) and/or CLUE II (1989). Borderline and abnormal values are inside and above the dotted band, respectively. AU = arbitrary units.
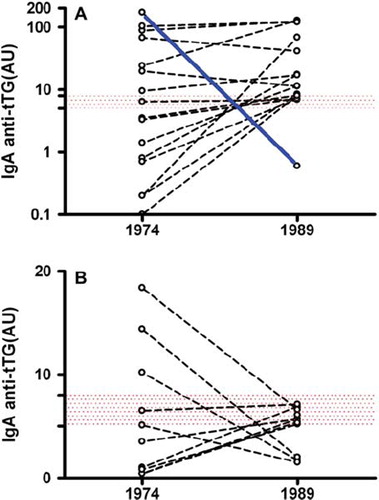
Table IB. Demographic and clinical data of subjects with a CD serology at CLUE I that deceased before CLUE II.
Figure 4. Results of the celiac screening in 840 participants that deceased after the CLUE I study.
Figure 5. Prevalence (and 95% CI) of CD in the US during the last decades. *Data for the year 2001 are taken from Fasano et al. (Citation4).