13,112
Views
917
CrossRef citations to date
0
Altmetric
ORIGINAL ARTICLE

Meta-analysis: Natural history of non-alcoholic fatty liver disease (NAFLD) and diagnostic accuracy of non-invasive tests for liver disease severity

, , &
Pages 617-649 | Received 11 Feb 2010, Accepted 11 Aug 2010, Published online: 02 Nov 2010

Figures & data

Figure 1. Evidence acquisition flow diagram. Quality scores of included studies are provided as median (range).

Figure 1. Evidence acquisition flow diagram. Quality scores of included studies are provided as median (range).

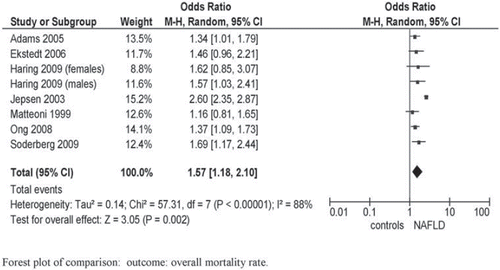
Figure 2. Mortality in NAFLD compared with the general population.

Figure 2. Mortality in NAFLD compared with the general population.

Table I. Prospective studies assessing the natural history of NAFLD, grouped according to definition of NAFLD (biochemical, radiological, or histological).

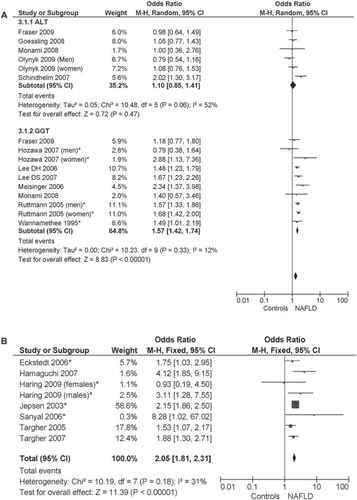
Figure 3. NAFLD as a risk factor for incident CVD events. NAFLD was defined biochemically (increase in ALT and GGT levels, panel A) or by ultrasound or histology (panel B). Forest plot of comparison: Meta-analysis of multiple-adjusted results (OR of top versus bottom quantile of ALT and GGT, panel A, or ultrasound-histologically diagnosed NAFLD, panel B) as determinants of incident CVD, outcome: incident CVD. NAFLD was defined by biochemical criteria (ALT or GGT elevation, panel A) or by ultrasonographic-histological criteria (panel B). OR adjusted for multiple variables from different community-based or population-based prospective studies () were pooled and analyzed by random or fixed effect models. *Studies assessing fatal CVD events.

Figure 3. NAFLD as a risk factor for incident CVD events. NAFLD was defined biochemically (increase in ALT and GGT levels, panel A) or by ultrasound or histology (panel B). Forest plot of comparison: Meta-analysis of multiple-adjusted results (OR of top versus bottom quantile of ALT and GGT, panel A, or ultrasound-histologically diagnosed NAFLD, panel B) as determinants of incident CVD, outcome: incident CVD. NAFLD was defined by biochemical criteria (ALT or GGT elevation, panel A) or by ultrasonographic-histological criteria (panel B). OR adjusted for multiple variables from different community-based or population-based prospective studies (Table I) were pooled and analyzed by random or fixed effect models. *Studies assessing fatal CVD events.

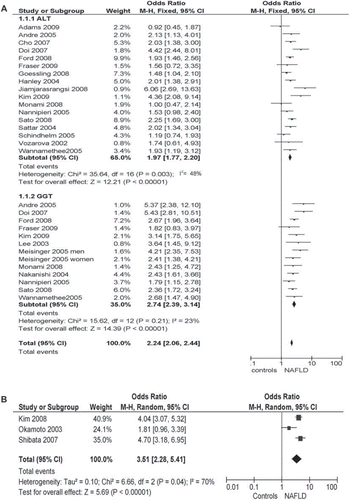
Figure 4. NAFLD as a risk factor for incident type 2 diabetes. NAFLD was defined biochemically (increase in ALT and GGT levels, panel A) or by ultrasound or histology (panel B). Forest plot of comparison: Meta-analysis of multiple-adjusted results (OR of top versus bottom quantile of ALT and GGT, panel A, or ultrasonographic NAFLD, panel B) as determinants of incident type 2 diabetes, outcome: incident type 2 diabetes. NAFLD was defined by biochemical criteria (ALT or GGT elevation, panel A) or by ultrasonographic criteria (panel B). OR adjusted for multiple variables from different community-based or population-based prospective studies () were pooled and analyzed by random or fixed effect models. *Studies assessing fatal CVD events.

Figure 4. NAFLD as a risk factor for incident type 2 diabetes. NAFLD was defined biochemically (increase in ALT and GGT levels, panel A) or by ultrasound or histology (panel B). Forest plot of comparison: Meta-analysis of multiple-adjusted results (OR of top versus bottom quantile of ALT and GGT, panel A, or ultrasonographic NAFLD, panel B) as determinants of incident type 2 diabetes, outcome: incident type 2 diabetes. NAFLD was defined by biochemical criteria (ALT or GGT elevation, panel A) or by ultrasonographic criteria (panel B). OR adjusted for multiple variables from different community-based or population-based prospective studies (Table I) were pooled and analyzed by random or fixed effect models. *Studies assessing fatal CVD events.

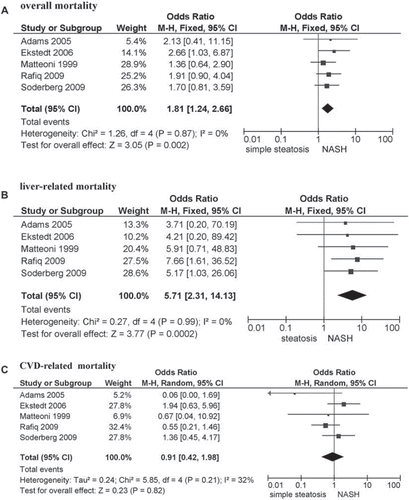
Figure 5. Outcomes of NASH compared to simple steatosis for overall mortality (panel A), liver-related mortality (panel B), or cardiovascular disease (CVD) mortality (panel C). Forest plot of comparison of NASH versus simple steatosis, outcomes: overall mortality (panel A), liver-related mortality (panel B), CVD mortality (panel C). OR adjusted for variables from different community-based or population-based prospective studies () were pooled and analyzed by random or fixed effect models.

Figure 5. Outcomes of NASH compared to simple steatosis for overall mortality (panel A), liver-related mortality (panel B), or cardiovascular disease (CVD) mortality (panel C). Forest plot of comparison of NASH versus simple steatosis, outcomes: overall mortality (panel A), liver-related mortality (panel B), CVD mortality (panel C). OR adjusted for variables from different community-based or population-based prospective studies (Table I) were pooled and analyzed by random or fixed effect models.

Table II. Panel A: Studies assessing biomarker panels validated for non-invasive assessment of the presence of NASH in patients with NAFLD. When > 1 study assessed the panel, summary estimates of diagnostic accuracy were calculated; when the panel was assessed in only 1 study, the AUROC is the summary estimate of the training and validation groups.

Table II. Panel B: Studies assessing biomarker panels validated for non-invasive assessment of fibrosis in patients with NAFLD. When > 1 study assessed the panel, summary estimates of diagnostic accuracy were calculated.

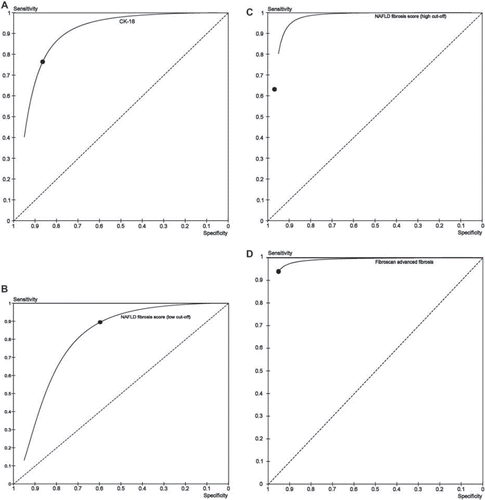
Figure 6. Summary ROC curve and summary point of plasma CK-18 for diagnosing NASH (panel A), and of NAFLD fibrosis score (low cut-off, panel B), NAFLD (high cut-off, panel C), and Fibroscan (panel D) for advanced fibrosis.

Figure 6. Summary ROC curve and summary point of plasma CK-18 for diagnosing NASH (panel A), and of NAFLD fibrosis score (low cut-off, panel B), NAFLD (high cut-off, panel C), and Fibroscan (panel D) for advanced fibrosis.

Table III. Suggested assessment of patients with NAFLD for general physicians.
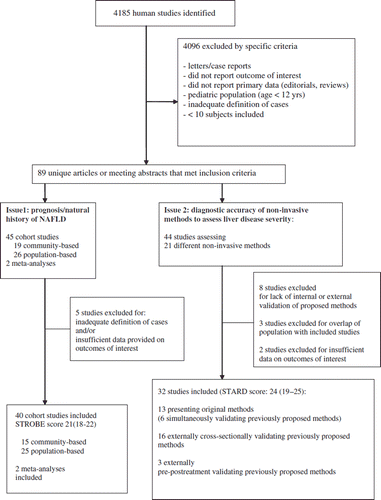
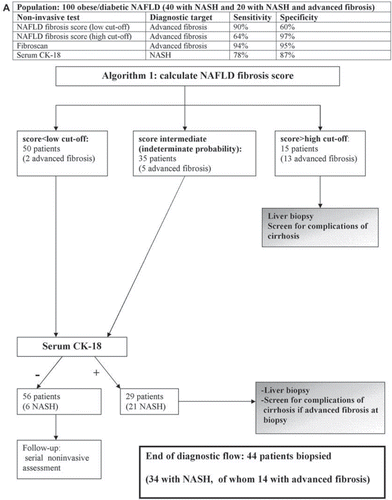
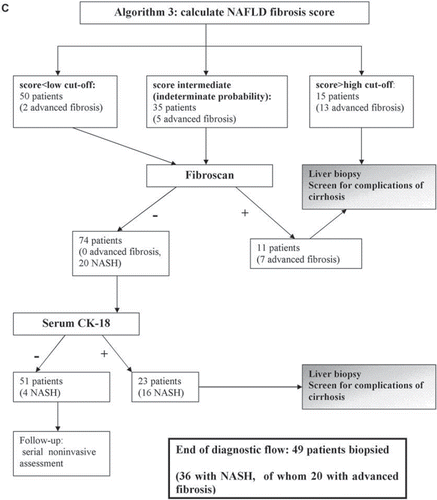
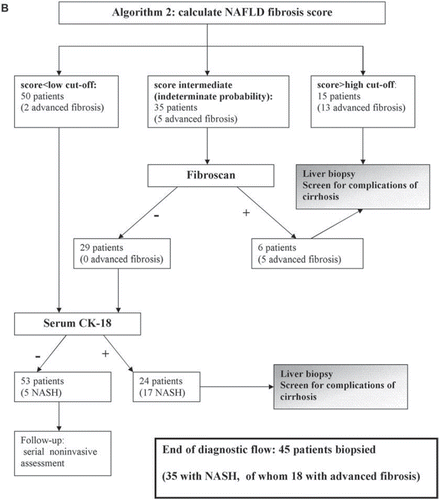
Figure 7. Proposed diagnostic algorithms combining non-invasive methods and liver biopsy. Algorithm 1 can be applied to any patient with NAFLD; algorithm 2 and 3 can be applied only to non-obese patients with NAFLD, since Fibroscan has limitations when BMI > 30 kg/m2. In the third algorithm Fibroscan is applied to patients with a low and intermediate score for fibrosis, which implies a wider availability of Fibroscan, has the advantage of individuating all patients with advanced fibrosis, but it biopsies more patients with simple steatosis than the first model (13 versus 10 patients).

All models are conservative estimates of diagnostic performance of NAFLD fibrosis score and Fibroscan, i.e. they assume that all biopsied patients without advanced fibrosis in the first 2 steps have simple steatosis, not NASH, since the diagnostic performance of NAFLD fibrosis score and Fibroscan for detecting NASH is currently unknown.

Explanation: Based on our meta-analysis, three sequential diagnostic algorithms are proposed to individuate NASH, with and without advanced fibrosis; such algorithms require further prospective evaluation in large-scale multicenter cohort studies.

If a sample of 100 NAFLD subjects underwent a single LB, NASH would be found in 40 subjects, of which 20 would have advanced fibrosis (LB-to-all approach). In combined approaches, the first step should be the identification of patients with NASH and advanced fibrosis, requiring prompt gastroenterological referral. To this aim, NAFLD fibrosis score and Fibroscan may be combined with LB.

If we apply NAFLD fibrosis score to our NAFLD sample, this would direct 15 patients (13 with advanced fibrosis) to biopsy and leave 50 patients with a low probability and 35 patients with an indeterminate probability. If patients are obese, then the next step would target NASH with CK-18 measurement. At the end of diagnostic flow, 44 patients would be referred for LB (algorithm 1).

In non-obese subjects Fibroscan is reliable and accurate and may be applied after NAFLD fibrosis score to screen for advanced fibrosis patients with an indeterminate probability (algorithm 2) or with both an indeterminate and low probability (algorithm 3), depending on the local availability and experience.

At the end of the diagnostic flow, algorithm 2 would direct 45 patients (25 NASH, of whom 18 with advanced fibrosis) to LB; algorithm 3 would direct 49 patients (35 NASH, of whom 20 with advanced fibrosis) to LB.

Figure 7. Proposed diagnostic algorithms combining non-invasive methods and liver biopsy. Algorithm 1 can be applied to any patient with NAFLD; algorithm 2 and 3 can be applied only to non-obese patients with NAFLD, since Fibroscan has limitations when BMI > 30 kg/m2. In the third algorithm Fibroscan is applied to patients with a low and intermediate score for fibrosis, which implies a wider availability of Fibroscan, has the advantage of individuating all patients with advanced fibrosis, but it biopsies more patients with simple steatosis than the first model (13 versus 10 patients).All models are conservative estimates of diagnostic performance of NAFLD fibrosis score and Fibroscan, i.e. they assume that all biopsied patients without advanced fibrosis in the first 2 steps have simple steatosis, not NASH, since the diagnostic performance of NAFLD fibrosis score and Fibroscan for detecting NASH is currently unknown.Explanation: Based on our meta-analysis, three sequential diagnostic algorithms are proposed to individuate NASH, with and without advanced fibrosis; such algorithms require further prospective evaluation in large-scale multicenter cohort studies.If a sample of 100 NAFLD subjects underwent a single LB, NASH would be found in 40 subjects, of which 20 would have advanced fibrosis (LB-to-all approach). In combined approaches, the first step should be the identification of patients with NASH and advanced fibrosis, requiring prompt gastroenterological referral. To this aim, NAFLD fibrosis score and Fibroscan may be combined with LB.If we apply NAFLD fibrosis score to our NAFLD sample, this would direct 15 patients (13 with advanced fibrosis) to biopsy and leave 50 patients with a low probability and 35 patients with an indeterminate probability. If patients are obese, then the next step would target NASH with CK-18 measurement. At the end of diagnostic flow, 44 patients would be referred for LB (algorithm 1).In non-obese subjects Fibroscan is reliable and accurate and may be applied after NAFLD fibrosis score to screen for advanced fibrosis patients with an indeterminate probability (algorithm 2) or with both an indeterminate and low probability (algorithm 3), depending on the local availability and experience.At the end of the diagnostic flow, algorithm 2 would direct 45 patients (25 NASH, of whom 18 with advanced fibrosis) to LB; algorithm 3 would direct 49 patients (35 NASH, of whom 20 with advanced fibrosis) to LB.
Supplemental material

Funnel plots of studies assessing the natural history of NAFLD

Download PDF (302.7 KB)

Reprints and Corporate Permissions

Please note: Selecting permissions does not provide access to the full text of the article, please see our help page How do I view content?

To request a reprint or corporate permissions for this article, please click on the relevant link below:

Academic Permissions

Please note: Selecting permissions does not provide access to the full text of the article, please see our help page How do I view content?

Obtain permissions instantly via Rightslink by clicking on the button below:

If you are unable to obtain permissions via Rightslink, please complete and submit this Permissions form. For more information, please visit our Permissions help page.