Figures & data
Figure 1. Forest plot of all-cause mortality among patients with chronic heart failure randomized to biomarker-guided therapy versus control. The size of the marker for the point estimate (diamond) is proportional to the sample size for each study. Horizontal lines show 95% confidence intervals. From Felker et al., American Heart Journal, 2009, with permission (Citation18).
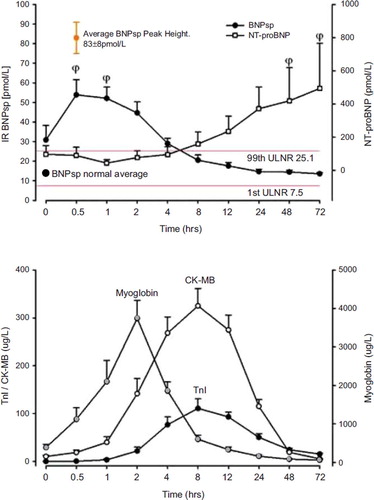
Figure 2. Plasma levels of BNPsp, NT-proBNP, myoglobin, CK-MB, and troponin I in 25 patients with acute myocardial infarction and ST-segment elevation presenting within 4 hours of the onset of symptoms. Data are shown as mean ± SEM. From Siriwardena et al., Circulation, 2010, with permission (Citation71).