1,334
Views
75
CrossRef citations to date
0
Altmetric
Research Article

Genetic variants in BCMO1 and CD36 are associated with plasma lutein concentrations and macular pigment optical density in humans

, , , , , , , , & show all
Pages 47-59 | Received 04 Feb 2010, Accepted 04 Oct 2010, Published online: 22 Nov 2010

Figures & data

Table I. Characteristics and nutrient intake of the 29 male subjects enrolled in the clinical study.a

Table II. Characteristics of the studied SNPs.

Figure 1. A: Plasma lutein concentrations, before and after supplementation, in both the group that took the placebo and the group that took the lutein supplement. White bars: values measured before supplementation. Black bars: values measured after supplementation. Means ± SEM of 15 subjects in placebo group and 14 subjects in lutein group. An asterisk indicates a significant difference (P < 0.05) between values measured before and after the supplementation period in each group (paired t test). B: Individual plasma lutein concentrations, before and after supplementation, in the placebo group. C: Individual plasma lutein concentrations, before and after supplementation, in the lutein-supplemented group.
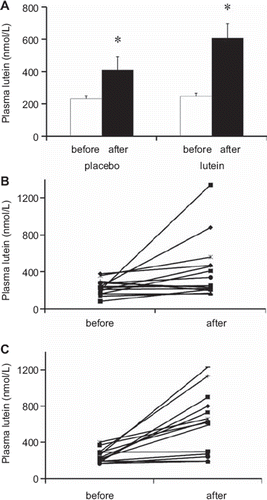
Figure 1. A: Plasma lutein concentrations, before and after supplementation, in both the group that took the placebo and the group that took the lutein supplement. White bars: values measured before supplementation. Black bars: values measured after supplementation. Means ± SEM of 15 subjects in placebo group and 14 subjects in lutein group. An asterisk indicates a significant difference (P < 0.05) between values measured before and after the supplementation period in each group (paired t test). B: Individual plasma lutein concentrations, before and after supplementation, in the placebo group. C: Individual plasma lutein concentrations, before and after supplementation, in the lutein-supplemented group.

Figure 2. Base-line plasma lutein concentrations for each BCMO1 rs7501331 genotype. A: uncorrected values. B: Values corrected for plasma total cholesterol. Data are means ± SEM of 28 subjects; n is the number of subjects in each genotype group. An asterisk indicates a significant difference (P < 0.05) between genotype groups (Student's t test).
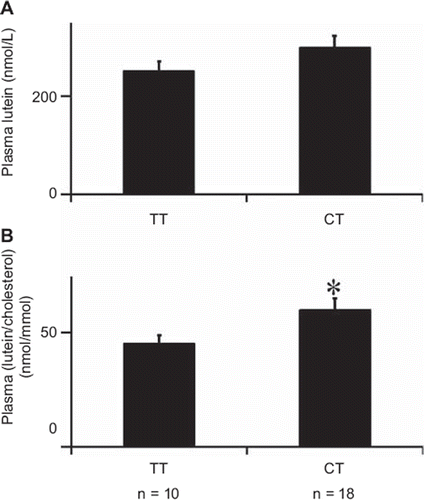
Figure 2. Base-line plasma lutein concentrations for each BCMO1 rs7501331 genotype. A: uncorrected values. B: Values corrected for plasma total cholesterol. Data are means ± SEM of 28 subjects; n is the number of subjects in each genotype group. An asterisk indicates a significant difference (P < 0.05) between genotype groups (Student's t test).

Figure 3. Base-line plasma lutein concentrations for each CD36 rs13230419 genotype. A: uncorrected values. B: Values corrected for plasma total cholesterol. Data are means ± SEM of 25 subjects; n is the number of subjects in each genotype group. In each figure, different letters indicate significant differences (P < 0.05) between genotype groups (ANOVA).
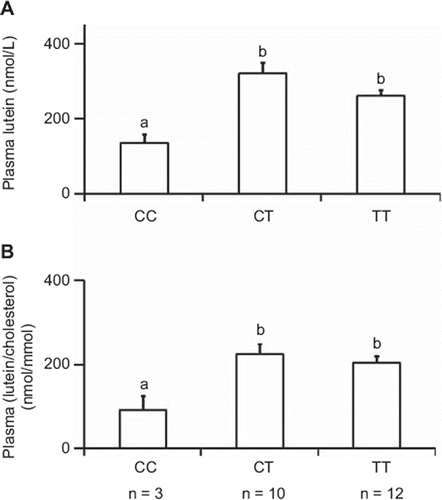
Figure 3. Base-line plasma lutein concentrations for each CD36 rs13230419 genotype. A: uncorrected values. B: Values corrected for plasma total cholesterol. Data are means ± SEM of 25 subjects; n is the number of subjects in each genotype group. In each figure, different letters indicate significant differences (P < 0.05) between genotype groups (ANOVA).

Table III. BCMO1 haplotypes effects on plasma lutein/zeaxanthin.

Table IV. CD36 haplotypes effects on plasma lutein/zeaxanthin.

Figure 4. A: MPOD (macular pigment optical density), before and after supplementation, in the group that took the placebo and the group that took the lutein supplement. White bars: values measured before supplementation (before). Black bars: values measured after supplementation (after). Means ± SEM of 15 subjects in placebo group and 14 subjects in lutein group. An asterisk indicates a significant difference (P < 0.05) between values measured before and after the supplementation period in each group (paired t test). B: Individual MPOD before and after supplementation in the lutein-supplemented group (n = 14).
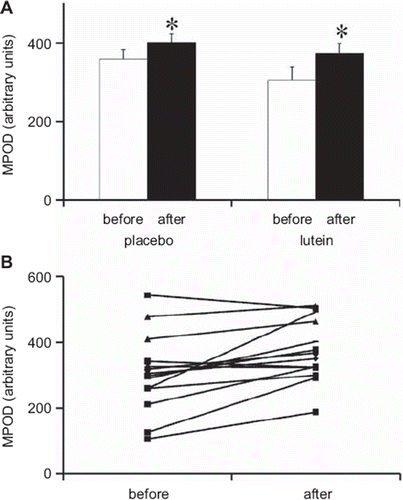
Figure 4. A: MPOD (macular pigment optical density), before and after supplementation, in the group that took the placebo and the group that took the lutein supplement. White bars: values measured before supplementation (before). Black bars: values measured after supplementation (after). Means ± SEM of 15 subjects in placebo group and 14 subjects in lutein group. An asterisk indicates a significant difference (P < 0.05) between values measured before and after the supplementation period in each group (paired t test). B: Individual MPOD before and after supplementation in the lutein-supplemented group (n = 14).

Figure 5. A: MPOD response as a function of plasma lutein response. B: MPOD response as a function of initial MPOD. ‘Response’ indicates the differences between the values measured after the dietary intervention and the values measured before the intervention (n = 29). White dots: subjects in the placebo group. Black dots: subjects in the lutein-supplemented group.
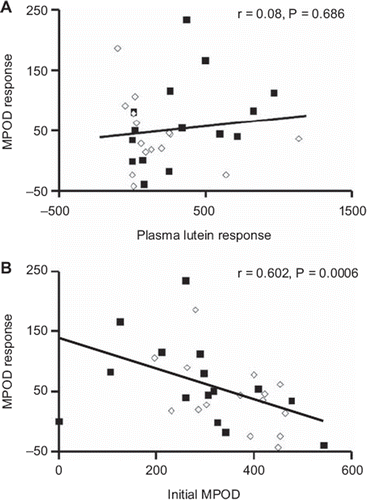
Figure 5. A: MPOD response as a function of plasma lutein response. B: MPOD response as a function of initial MPOD. ‘Response’ indicates the differences between the values measured after the dietary intervention and the values measured before the intervention (n = 29). White dots: subjects in the placebo group. Black dots: subjects in the lutein-supplemented group.

Figure 6. MPOD for each BCMO1 and CD36 genotype. A: BCMO1 rs7501331 genotypes. An asterisk indicates a significant difference (P < 0.05) between genotype groups (Student's t test). B: CD36 rs1761667 genotypes. Different letters indicate significant differences (P < 0.05) between genotype groups (ANOVA); n is the number of subjects in each genotype group.
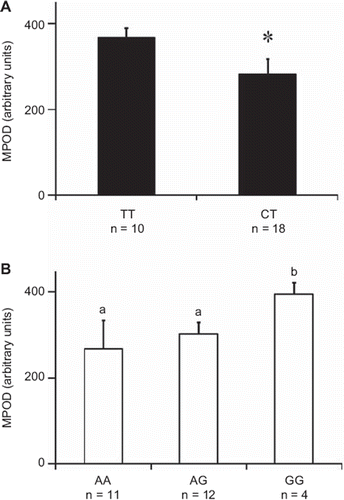
Figure 6. MPOD for each BCMO1 and CD36 genotype. A: BCMO1 rs7501331 genotypes. An asterisk indicates a significant difference (P < 0.05) between genotype groups (Student's t test). B: CD36 rs1761667 genotypes. Different letters indicate significant differences (P < 0.05) between genotype groups (ANOVA); n is the number of subjects in each genotype group.

Reprints and Corporate Permissions

Please note: Selecting permissions does not provide access to the full text of the article, please see our help page How do I view content?

To request a reprint or corporate permissions for this article, please click on the relevant link below:

Academic Permissions

Please note: Selecting permissions does not provide access to the full text of the article, please see our help page How do I view content?

Obtain permissions instantly via Rightslink by clicking on the button below:

If you are unable to obtain permissions via Rightslink, please complete and submit this Permissions form. For more information, please visit our Permissions help page.