Figures & data
Table I. Selected base-line characteristics of study population by age.
Table II. Base-line serum total cholesterol, HDL-cholesterol, and triglycerides (mmol/L) (SE) by demography, cognition, need of care, and multi-morbidity.
Table III. Mean values of serum lathosterol and sitosterol (μg × 102 × mg of cholesterol, mean (SE)) by gender, age, body mass index, diabetes, cognition, and need of care.
Figure 1. Kaplan–Meier curves for 17-year cumulative survival by tertiles of serum total cholesterol (Panel A), lathosterol/cholesterol ratios (Panel B), and sitosterol/cholesterol ratios (Panel C).
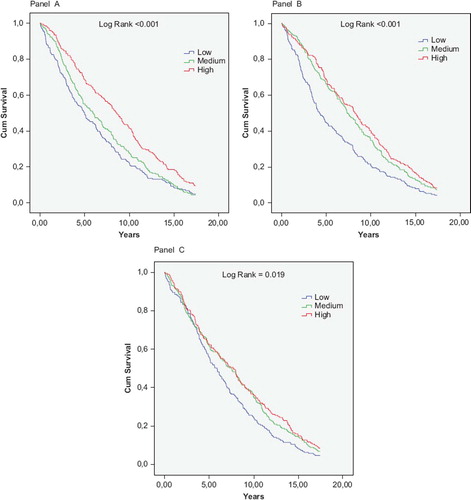
Table IV. Lower cholesterol (< 5 mmol/L), lathosterol/cholesterol (< median), and sitosterol/cholesterol (< median) as predictors of all-cause and vascular mortality.
Figure 2. Low serum total cholesterol (< 5 mmol/L (Panel A)) and low (< median) lathosterol and sitosterol through cholesterol ratios (Panel B) as risk indicators (HR and 95% CI) of all-cause mortality by age and gender. Number of subjects (events/total) in parentheses.
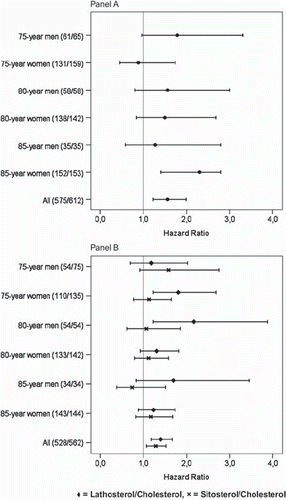
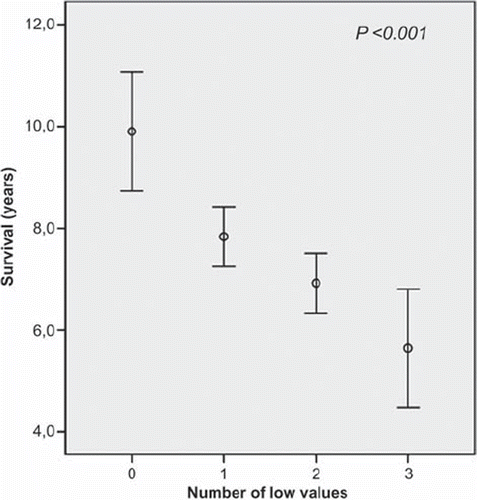
Figure 3. Age- and gender-adjusted survival (mean and 95% CI) by the number of lower (< median) serum cholesterol, lathosterol, and sitosterol (0 = all values < median (n = 58), 1 = one measure < median (n = 223), 2 = two measures < median (n = 224), 3 = three measures < median (n = 57)).