Figures & data
Table I. Baseline characteristics of patients.
Figure 1. The urinary excretion of AGT reflected renal AGT expression. A: Ln (urinary AGT/Cr) was significantly and positively correlated with AGT/β-actin measured using Western blotting (n = 63). B: Ln (urinary AGT/Cr) was significantly and positively correlated with kidney AGT density measured using immunohistochemistry (n = 35). C: There was a significant positive correlation between AGT/β-actin and kidney AGT density (n = 35). D: Representative Western blots and tissue sections showing AGT expression. Arrows indicate the AGT-stained tubules. (a) High expression of AGT; (b) intermediate expression of AGT; (c) low expression of AGT; magnification ×200 (AU = arbitrary unit).
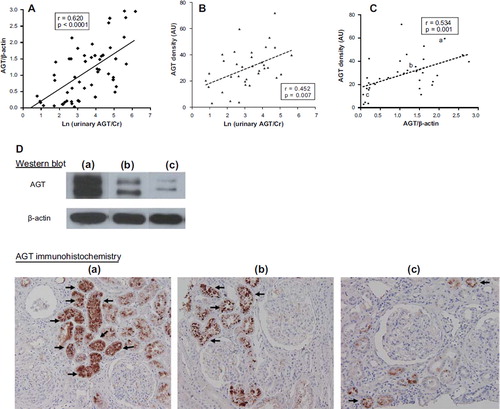
Figure 2. Plasma AGT level was not correlated with urinary AGT excretion or renal AGT expression. A: Ln (urinary AGT/Cr) was not correlated with ln (plasma AGT) (n = 64). B: There was no correlation between ln (plasma AGT) and AGT/β-actin (n = 63). C: There was no correlation between ln (plasma AGT) and kidney AGT density (n = 35) (AU = arbitrary unit).
Figure 3. Urinary AGT excretion was positively correlated with urinary PCR and negatively correlated with eGFR. A: Ln (urinary AGT/Cr) was significantly and positively correlated with urinary PCR (n = 64). B: Ln (urinary AGT/Cr) was negatively correlated with eGFR (n = 64). C: There was no correlation between ln (plasma AGT) and urinary PCR (n = 64). D: There was no correlation between ln (plasma AGT) and eGFR (n = 64).
Figure 4. Urinary AGT excretion was positively correlated with urinary PCR 3 years later and negatively correlated with % change of eGFR for 3 years. A: Urinary PCR measured after 3 years of follow-up was positively correlated with ln (urinary AGT/Cr) (n = 52). B: Ln (urinary AGT/Cr) correlated negatively with percent change of eGFR for 3 years (n = 52).
Table II. Logistic regression analysis for patients with persistent overt proteinuria after 3 years.
Table III. Determinants of renal function (eGFR) after 3 years.