Figures & data
Table I. Base-line study characteristics (n = 700).
Table II. The most common DBI medications used in the GeMS population.
Table III. Unadjusted and adjusted analysis of covariance for association of DBI with outcomes.
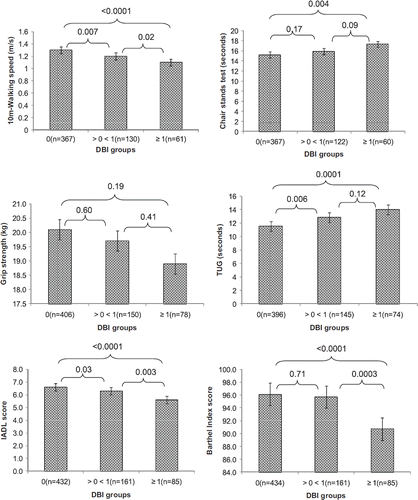
Figure 1. Adjusted means of functional outcome measures according to the DBI exposure. 10-m walking speed: higher scores indicated faster speed; chair stands test and TUG: lower score indicated better performance; grip strength, IADL, and Barthel Index: higher score indicating better performance. Models adjusted for age, sex, education, comorbidites, self-reported status and cognitive impariment. The y-axis does not consistently start at 0. Error bars represent standard error. DBI = drug burden index; IADL = instrumental activities of daily living; TUG = timed up and go.