Figures & data
Figure 1. ECG (50 mm/s) shows the global ischemia ECG pattern: ST depression and inverted T waves maximally in leads V4–5 and ST elevation in lead aVR.
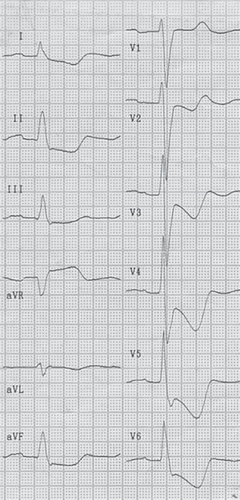
Figure 2. Distribution of ECG changes of all consecutive patients admitted with acute coronary syndrome. Rates are based on the TACOS study, n = 1,188.
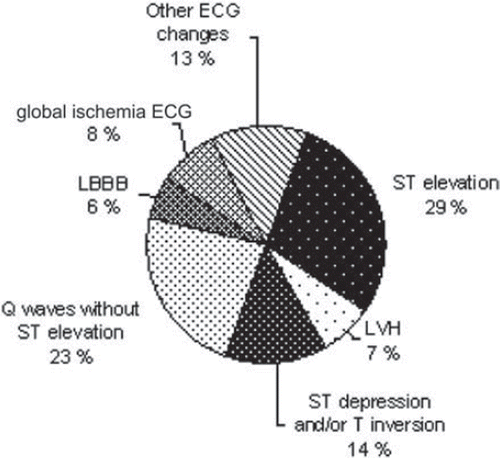
Table I. Base-line characteristics according to electrocardiographic classification.
Table II. In-hospital findings, treatment, and outcome by electrocardiographic categories. Medication at discharge.
Figure 3. The rate of composite end-points at 10-month follow-up according to the ECG at admission presented by the Kaplan–Meier curve (dashed line: global ischemia ECG, solid line: all other ECG categories).
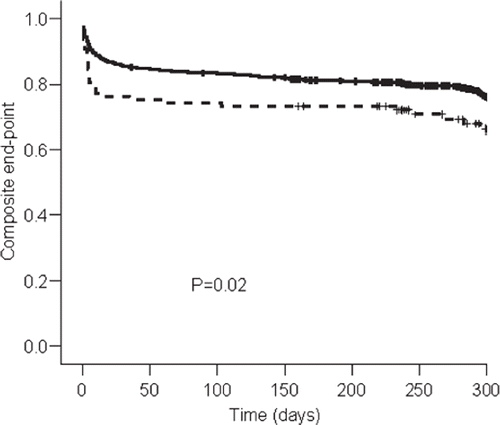
Table III. Variables retained in the final multivariate Cox proportional hazards model examining the rate of composite end-points at 10-month follow-up.