Figures & data
Figure 1. The ECG in hypertrophic cardiomyopathy. High QRS voltage in the absence of hypertension with repolarization changes (strain pattern) in the ST segments of inferior and lateral leads, and inversion of terminal P wave in lead V1. Notching of the QRS up-stroke in inferior leads, giving a delta wave-like appearance, is also detected. Paper speed 25 mm/s, gain 10 mm/mV.
Figure 2. ECG manifestation of apical hypertrophic cardiomyopathy. ST segment and T wave abnormalities similar to repolarization abnormalities seen in ischemia are commonly observed in the antero-apical leads in apical hypertrophic cardiomyopathy. QRS voltage may not be as prominent as in obstructive or diffuse HCM. Paper speed 25 mm/s, gain 10 mm/mV.
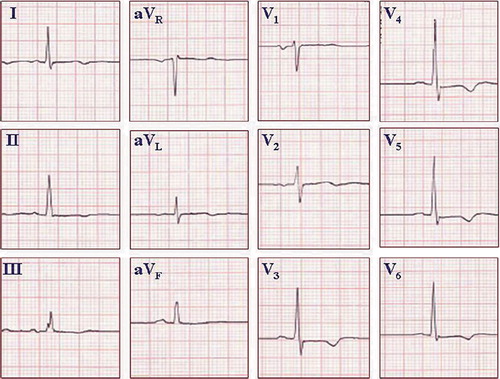
Figure 3. ECG from a healthy young athlete. The pattern of an ‘athlete heart’ may mimic the ECG changes seen in HCM. QRS voltage criteria for LVH based on the Sokolow–Lyon criteria, ST segment abnormalities similar to strain pattern, and inversion of terminal P wave in lead V1 may all be present. An echocardiogram may be needed to exclude the possibility of HCM. If uncertain, serial echocardiograms may be repeated over time, because the anatomic pattern of HCM may lag behind the ECG changes. Paper speed 25 mm/s, gain 10 mm/mV.
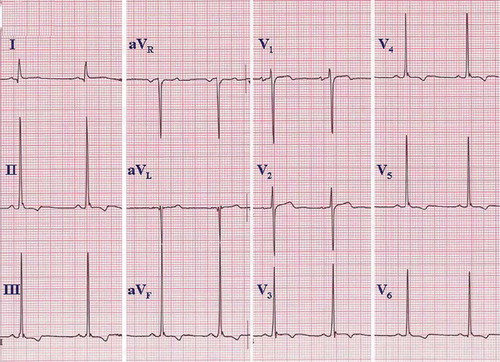
Figure 4. Arrhythmogenic right ventricular dysplasia. A: ECG on top presents ventricular tachycardia with left bundle branch block QRS morphology, and ECG below taken from the same patient demonstrates T wave inversions in the right precordial leads (V1–3), characteristic of ARVD. Paper speed 25 mm/s, gain 10 mm/mV. B: ECG presents a subtle epsilon wave in leads V1–3 without T wave inversions. Paper speed 25 mm/s, gain 10 mm/mV.
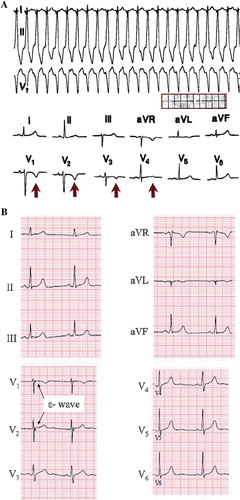
Figure 5. Wolff–Parkinson–White syndrome. A: Rapid conduction through an antero-septal accessory pathway during atrial fibrillation in WPW syndrome, mimicking the appearance of ventricular tachycardia. The irregular ventricular response pattern suggests atrial fibrillation. B: Delta waves indicated with arrows. ECG from different patient than in A. Paper speed 25 mm/s, gain 10 mm/mV.
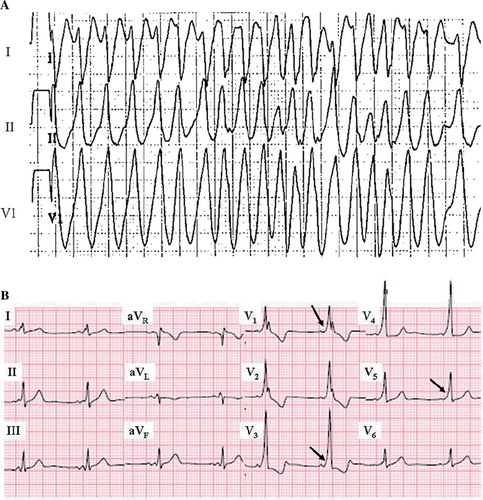
Figure 6. The ECG in long QT syndrome. QTc of 610 ms, with a T wave morphology suggesting type 2 long QT, is recorded from a 25-year-old female with a history of recurrent syncope and torsade de pointes. Paper speed 25 mm/s, gain 10 mm/mV.
Figure 7. ECG manifestations of subtypes of long QT syndrome. Left: Type 3 long QT with the characteristic late onset of the T wave. Center: Type 2 long QT showing a biphasic T wave (i.e. U wave fused to the end of the T wave). Right panel: type 1 long QT with ‘giant’ broad T wave. Paper speed 25 mm/s, gain 10 mm/mV. Reprinted with permission from Moss AJ et al. ECG T-wave patterns in genetically distinct forms of the hereditary long QT syndrome. Circulation. 1995;92:2929–34. Wolters Kluwer Health. ©
Figure 8. ECG manifestation of short QT syndrome. A short QT interval (QTc 292 ms) with high, peaked T waves in right precordial leads. This patient had ventricular fibrillation at the age of 18 and was successfully resuscitated. Later on the patient received an ICD. Paper speed 50 mm/s, gain 10 mm/mV.
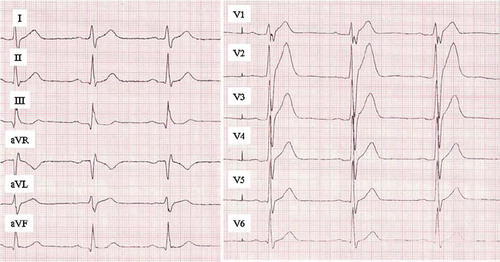
Figure 9. ECG manifestations of Brugada syndrome. A: Both ECGs in this panel demonstrate typical type I (coved type) Brugada syndrome ECG pattern; RBBB-like pattern with distinct ST segment elevation and T wave inversion in the right (V1–3) precordial leads. Additional changes on the right side ECG, such as longer QRS duration and prominent R’ wave in aVR, have been associated to poor prognosis. Paper speed 25 mm/s, gain 10 mm/mV. Reprinted with permission from Junttila MJ et al. Differences in 12-lead electrocardiogram between symptomatic and asymptomatic Brugada syndrome patients. J Cardiovasc Electrophysiol. 2008;19:380–3. Wiley-Blackwell Publishing. © B: Brugada syndrome subtypes are shown. Left: Typical type I (coved type) Brugada syndrome ECG pattern. Middle: Type II (saddleback) Brugada ECG pattern. The T waves in the right precordial are upright, differentiating it from type I. Right: Type III Brugada ECG pattern. Similar changes to that of type II, but with minimal (< 0.2 mV) ST segment elevation. Paper speed 50 mm/s, gain 10 mm/mV. Reprinted with permission from Junttila MJ et al. Prevalence and prognosis of subjects with Brugada-type ECG pattern in a young and middle-aged Finnish population. Eur Heart J. 2004;25:874–8. Oxford University Press. ©
Figure 10. ECG manifestation of inferior early repolarization. Slurred early repolarization pattern in the inferior leads, i.e. deflection from the descending part of the R wave with a smooth transition to ST segment.