Figures & data
Figure 1. Study disposition. (AE = adverse event; CEL = celecoxib; mITT = modified intent-to-treat; NAP/ESO = naproxen/esomeprazole magnesium; PBO = placebo; PP = per protocol.) Hochberg et al, Curr Med Res Opin, 2011; 27: 1243-53, copyright © 2011, Informa Healthcare. Reproduced with permission of Informa Healthcare.
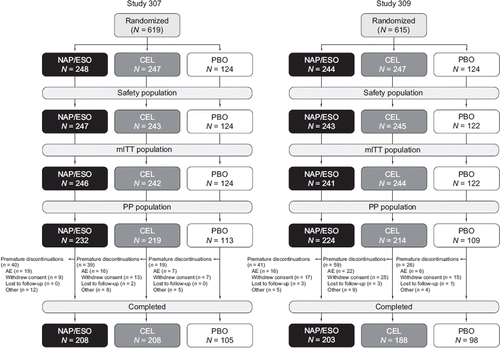
Table I. Patient demographics and baseline characteristics.
Figure 2. Change from baseline to week 12 in mSODA pain scores (LS mean) in patients treated with naproxen/esomeprazole magnesium, celecoxib, and placebo (mITT population with last observation carried forward). 95% CI on treatment difference for naproxen/esomeprazole magnesium minus celecoxib in Study 307: −0.4, 1.9; P = 0.1828; and for Study 309: −1.8, 0.6; P = 0.2979. (CEL = celecoxib; mITT = modified intent-to-treat; LS = least squares; mSODA = modified Severity of Dyspepsia Assessment; NAP/ESO = naproxen/esomeprazole magnesium; PBO = placebo.)
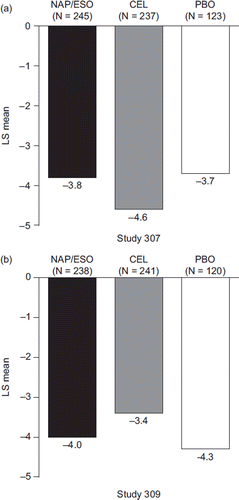
Table II. Mean change from baseline to week 6 and week 12 in mSODA pain scores in LDA users and non-users (mITT population).
Figure 3. Proportion of heartburn-free days (LS mean %) from baseline to week 12 in patients treated with naproxen/esomeprazole magnesium, celecoxib, and placebo (mITT population). 95% CI on treatment difference for naproxen/esomeprazole magnesium minus celecoxib in Study 307: −2.1, 12.7; and for Study 309: 2.5, 13.4. (CEL = celecoxib; mITT = modified intent-to-treat; LS = least squares; NAP/ESO = naproxen/esomeprazole magnesium; PBO = placebo.)
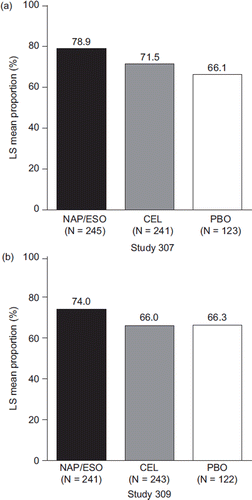
Table III. Summary of predefined UGI AEs and discontinuations as a result of UGI AEs or any AE (safety population).
Table IV. Treatment-emergent AEs: Overall and reported by ≥ 3% of patients in any treatment group of either study (safety population).