Figures & data
Figure 1. Study design and patient flow.
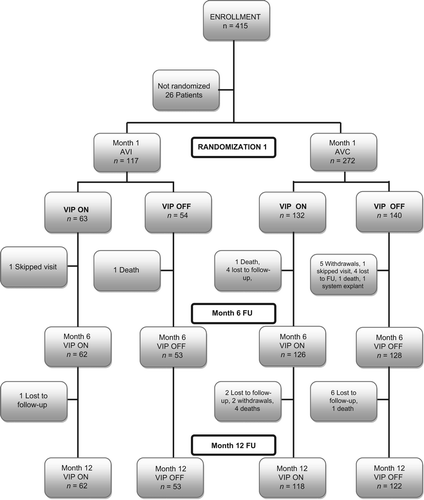
Table I. Baseline characteristics of the study population.
Table II. Cardiovascular adverse events and deaths within VIP ON and VIP OFF groups.
Table III. Percentage of ventricular pacing at 12 months for patients in both AVi and AVc groups.
Figure 2. Comparison of %VP at 12 months in four different pacing configurations with box plots of %VP for four pacing configuration within VIP ON group (A) and within VIP OFF group (B). P values are introduced with pacing configurations between lateral–apex compared to other configurations (A) and between septal–septal compared to other pacing configurations (B). Box plot graphs denote 90th and 10th percentiles (whiskers), 75th and 25th percentiles (boxes), medians (horizontal black lines in the boxes), means (black dots), and observations above 90th or below 10th percentile (open square). P values for interactions between two pacing configurations are shown.
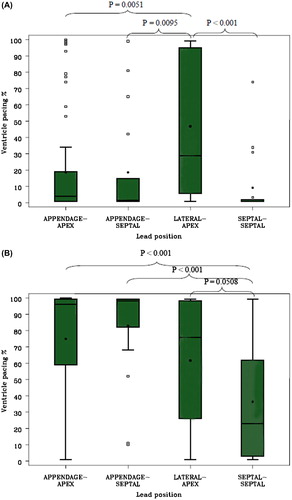
Table IV. The frequencies in different lead positions between RA–RV lead positions and AVc and AVi groups. Only the four most frequent were analyzed, because the remaining groups did not have enough patients from a statistical perspective.