Figures & data
Table I. Clinical characteristics of patients with hepatocellular carcinoma.
Table II. Cause of death in HCC patients.
Table III. The median serum concentrations and interquartile ranges of MMP-8, MMP-9, TIMP-1, α-fetoprotein, and the molar ratios of MMPs and TIMP-1 in patients with HCC.
Figure 1. Kaplan–Meier survival curves in patients with HCC. A: Low and high MMP-8 serum concentrations. B: low and high MMP-9 serum concentrations. C: Low and high TIMP-1 serum concentrations. D: Low and high molar ratios of MMP-8/TIMP-1. E: Low and high molar ratios of MMP-9/TIMP-1. F: Low and high AFP serum concentrations.
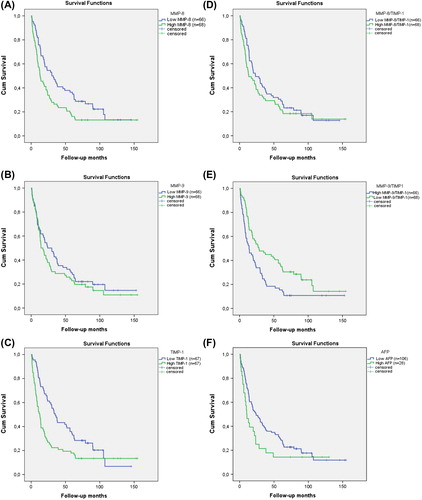
Table IV. Cox multivariable regression analysis of serum MMPs and clinical parameters in relation to overall survival of HCC patients.