Figures & data
Table I. Participant characteristics (means ± standard deviations).
Table II. The time intervals used for the four cycles.
Figure 1. Results of the unbiased analysis. The bars represent mean values (± SEM) of physical activity (in counts per hour ×1,000) for the four time intervals of each of the four cycles in each of the five countries. Codes for the time intervals are listed in Table II. The results of two-way ANOVAs are shown in Table III. Asterisks indicate probabilities associated with the F statistics obtained in post hoc one-way ANOVAs for each panel: ***P < 0.0001, *P < 0.05. Absence of asterisks indicates P > 0.10. When the main effect is significant, significance of multiple comparisons by Tukey’s test is indicated by lower-case letters: bars with different letters are significantly different from each other.
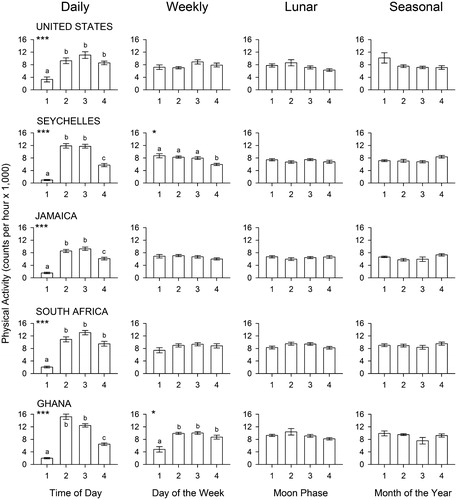
Table III. Results of two-way ANOVAs for the primary (unbiased) analysis.
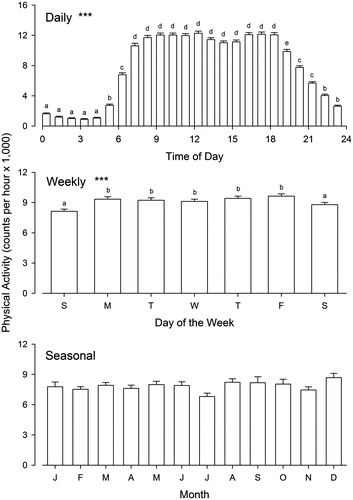
Figure 2. Results of the secondary analysis for the combined data set of men and women from the five countries. The bars represent mean values (± SEM) of physical activity (in counts per hour ×1,000). Asterisks indicate probabilities (corrected for multiple testing) associated with the F statistics obtained in one-way ANOVAs for each panel: ***P < 0.0001. Absence of asterisks indicates P > 0.10. When the main effect is significant, significance of multiple comparisons by Tukey’s test is indicated by lower-case letters: bars with different letters are significantly different from each other.