
Figures & data
Table I. Allele frequencies, genotype counts, and Hardy–Weinberg equilibrium P value of FTO rs9939609 variant.
Table II. Measurements of the risk factors for atherosclerosis and obesity-related peptide hormones at baseline in relation to FTO rs9939609 genotypes.
Table III. The all-cause mortality and major outcomes in relation to FTO rs9939609.
Table IV. The logistic regression analysis of the total mortality and cardiovascular outcomes in relation to FTO rs9939609.
Figure 1. The Kaplan–Meier curves of total, CVD, CHD, and cancer mortality. The graph includes both sexes together. The survival differs statistically significantly with respect to both CVD and CHD mortality.
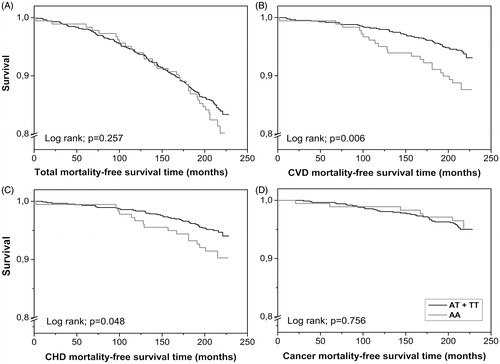
Table V. The Cox regression analysis of the total mortality and major causes of death in relation to FTO rs9939609.
Table VI. The Cox regression modeling of factors predicting CVD mortality.
Table VII. Discrimination of the risk models in prediction of cardiovascular event.
Table VIII. Reclassification of cases and non-cases according to cardiovascular event or death with and without FTO rs9939609 variant in the model where variables of best regression model (sex, age, systolic blood pressure, smoking, and baseline diabetes status) were included.