
Figures & data
Table I. Demographic, clinical, and biochemical characteristics of the GDM group and the control group.
Table II. Coronary flow reserve and echocardiographic measurements of the GDM group and the control group.
Figure 1. CFVR values for the patients with GDM group and the control group.
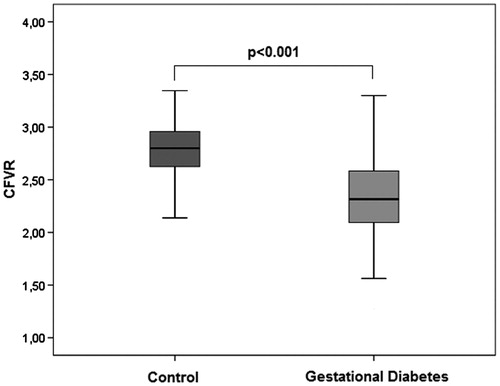
Figure 2. Correlation analysis of CFVR, mitral E/septal E', epicardial fat thickness, and hemoglobin A1c.
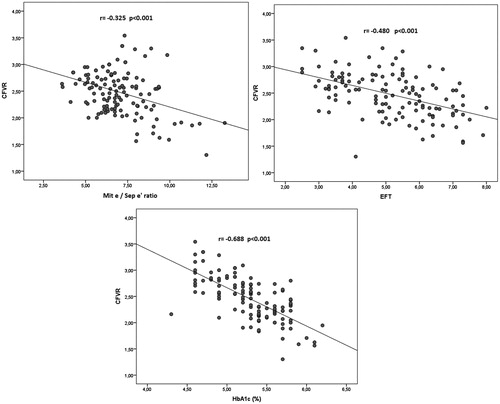
Table III. Correlation between CFVR and the study variables in the control group and in the patients with gestational diabetes group.
Table IV. Multiple linear regression analyses for CFVR as a dependent variable.