
Figures & data
Figure 1. Flow chart of the exclusion criteria adopted in the present study.
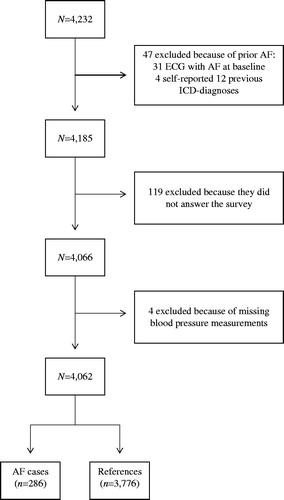
Table I. Baseline characteristics of men and women and entire cohort in incident AF cases and in the reference group.
Figure 2. Cumulative AF incidence according to PP quartiles. Cut-off points denoting PP quartiles were at 44.0, 52.5, and 62.5 mmHg. Q1, ≤44.0 mmHg; Q2, 44.1–52.5 mmHg; Q3, 52.6–62.5 mmHg; and Q4, >62.5 mmHg.
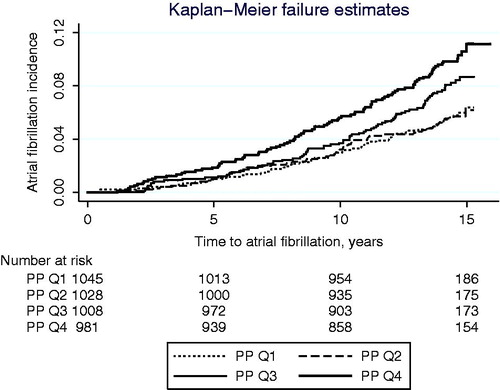
Table II. Hazard ratio (HR) and 95% confidence interval (CI) for incident AF per 1-SD increase in PP.
Table III. Hazard ratio (HR) and 95% confidence interval (CI) for incident AF per 1-SD increase in PP in normotensive and hypertensive individuals, respectively.