
Figures & data
Figure 1. Hospital admissions for acute myocardial infarction (MI) in the weeks following spring transition into daylight saving time (DST) compared to control weeks. Numbers show MI admissions on post-DST transition week per admissions on control weeks. Error bars represent 95% confidence intervals.
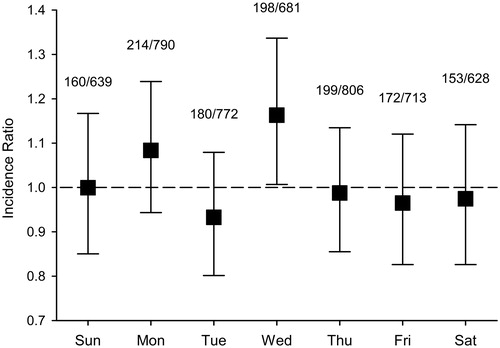
Table 1. Patient characteristics and co-diagnoses during the spring weeks after shift into DST (study group) and control weeks (control group) or represent association of a patient feature with occurrence of MI during a week after DST transition (study group) versus Control weeks (control group) (see Methods for details).
Figure 2. Hospital admissions for acute myocardial infarction (MI) in the weeks following autumn transition out of daylight saving time (DST) compared to control weeks. Numbers show MI admissions on post-DST transition week per admissions on control weeks. Error bars represent 95% confidence intervals.
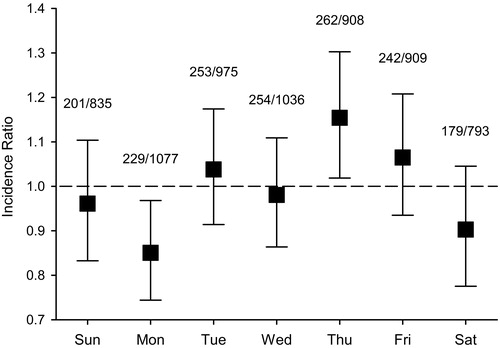
Table 2. Patient characteristics and co-diagnoses during the weeks after autumn shift out of DST (study group) and control weeks (control group) or represent association of a patient feature with occurrence of MI during a week after DST transition (study group) versus Control weeks (control group) (see Methods for details).