
Figures & data
Table 1. Baseline characteristics of patients and controls, overall and for each ethnic groups.
Figure 1. Receiver-operator characteristic curves. Receiver-operator characteristic (ROC) curves of ATP-III-FRS and PCE based risk score in the whole study population (Panel A) and in patients with premature STEMI and controls (Panel B) according to ethnicity (Europe and China). M: males; F: females; ATP-III-FRS: adult treatment panel III-Framingham Risk Score; PCE: Pooled Cohort Equations.
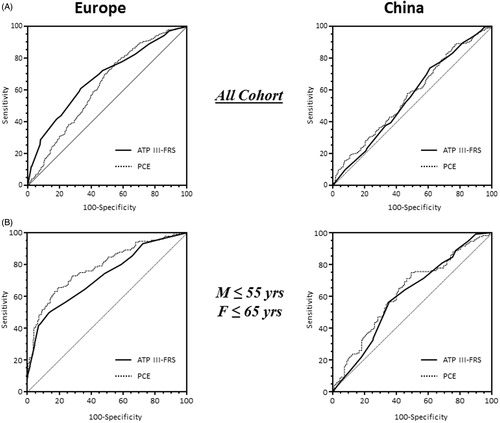
Figure 2. Histograms represent the distribution of categories of attributable treatment recommendations according to ATP-III and ACC/AHA guidelines in STEMI patients (Panels A and C) and controls (Panels B and D) divided by each ethnic group. White, light grey and dark grey bars denote the ‘treatment recommended’, ‘treatment considered’, and ‘no treatment’ categories, respectively. Histograms of all-ages STEMI and premature STEMI who would not be eligible for statin therapy are highlighted and percentages are nearby reported in panel A and panel C, respectively. Histograms of all-ages population controls and younger controls who would be eligible for statin treatment are highlighted and percentages are nearby reported in panel B and panel D, respectively. ATP-III: adult treatment panel III model; ACC/AHA: American College of Cardiology/American Heart Association guidelines model.
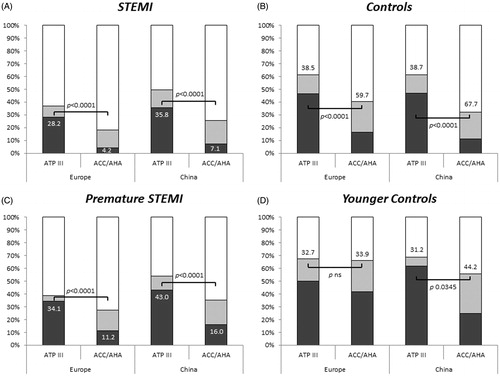
Table 2. Sensitivity and specificity of each guidelines model.
Table 3. Comparison of discrimination ability for each guidelines model.