
Figures & data
Figure 1. The levels of MHR (A), MC (B), and Gensini score (C) in patients with or without MACEs and the levels of Gensini score by MHR (D) or MC (E) tertiles.
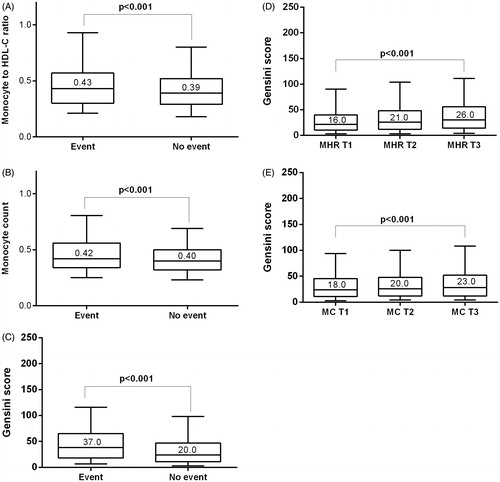
Table 1. Baseline and demographical characteristics of the study population.
Figure 2. The number of traditional cardiovascular risk factors by monocyte (A) or MHR (B) tertiles.
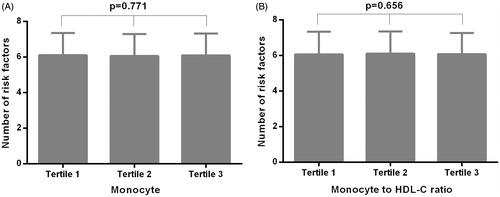
Table 2. Relationship of MHR or MC with cardiovascular characteristics.
Figure 3. The event-free survival analysis among monocyte (A) or MHR (B) tertiles.
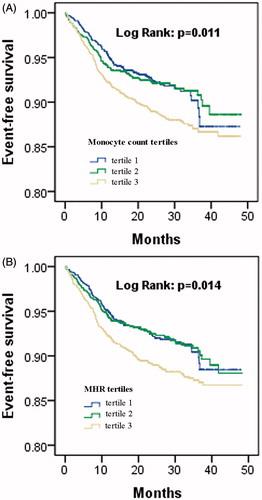
Figure 4. The ROC analysis revealing the value of MHR (A) and MC (B) in predicting the future MACEs.
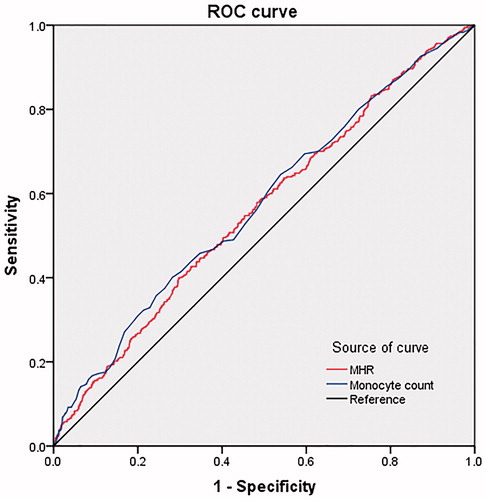
Table 3. Univariate Cox proportional hazard models results of the MACEs.
Table 4. Predictive value of white blood cell subsets and MHR tested by multivariate Cox proportional hazard models.