Figures & data
Figure 1. Flow chart of the study.
Table I. Base-line characteristics and drug treatment in all participants (n = 464) according to their B-type natriuretic peptide (BNP) tertiles.
Table II. Associations of clinical variables with base-line MMSE, decline of MMSE and new cases of dementia in 5-year follow-up.
Table III. Multivariable logistic regression model presenting adjusted odds ratios and 95% confidence intervals per 1 SD increase of clinical variables for the association with future dementia. The model on the left includes the variables significant in Table II. The model on the right is similar but also adjusted with the base-line MMSE.
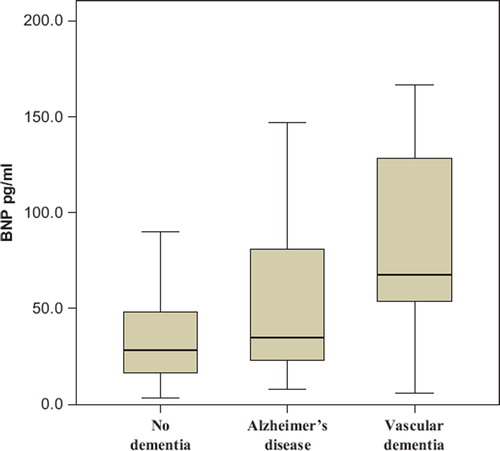
Figure 2. Box plots for B-type natriuretic peptide of the participants. Participants divided to groups according to their follow-up visit dementia status. Participants with no dementia (n = 230) BNP = mean 39.3 (SD 37.2) pg/mL, Alzheimer's disease (n = 42) BNP = 56.9 (57.6) pg/mL, vascular dementia (n = 10) BNP = 79.6 (56.7) pg/mL. ANOVA P = 0.001 in between the groups.