Figures & data
Figure 1. Adenovirus-mediated overexpression of p38 MAPK. Dyxin mRNA levels in rat left ventricles (A). Results (mean±SEM, n=9–10) are expressed as a ratio of dyxin mRNA to 18S mRNA as determined by Northern blot analysis. White columns, LacZ; black columns, p38 MAPK. Western blot analysis showing dyxin protein levels in rat left ventricles (B). Results are mean±SEM, n=8–10. White columns, LacZ; black columns, p38 MAPK. Immunohistochemistry with a specific dyxin antibody (400× magnification) revealed strong staining in the cytoplasm of endothelial cells in LacZ-treated control hearts (C), whereas only weak signal was observed in the cytoplasm of the vascular smooth muscle cells and cardiac myocytes except the inflammatory area surrounding the adenovirus injection site (D). MKK3bE + WTp38α-treated hearts show dyxin staining to be localized also to the nucleus of the myocytes (E). The endothelium in D and E is indicated with arrowhead **p<0.01 vs LacZ (Student's t-test).
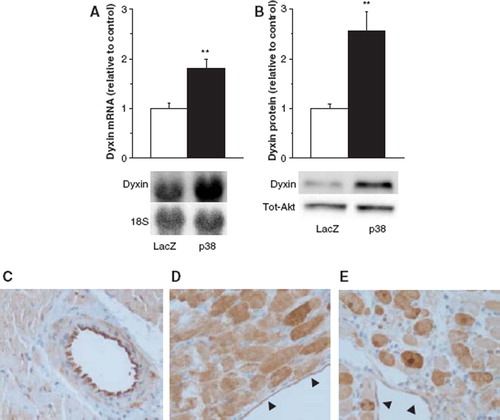
Figure 2. The effect of Ang II administration (33 μg/kg/h) on left ventricular dyxin mRNA levels in rats (A). Results are mean±SEM (n=6–8). ***p<0.00l, **p<0.0l vs vehicle (Student's t-test). White columns, vehicle; black columns, Ang II. Dyxin protein levels in the rat left ventricles (B). Results are mean±SEM (n=7–8). ***p<0.00l vs vehicle (Student's t-test). White columns, vehicle; black columns, Ang II. The effect of Ang II administration on dyxin nuclear, cytoplasmic and membrane protein levels at 3 days of Ang II infusion (C). Representative Western blots are shown. The effect of Ang II and AT1-receptor blockade by losartan (Los) on left ventricular dyxin mRNA levels at 6 h (D). Results are mean±SEM (n=6–7). ***p<0.00l vs vehicle. †††p<0.001 vs Ang II (ANOVA). The effect of Ang II and p38 MAPK inhibitor SB203580 on left ventricular dyxin mRNA levels at 6 h (E). Results are mean±SEM (n=4–7). ***p<0.00l vs vehicle. †p<0.05 vs Ang II (ANOVA). All mRNA results are expressed as a ratio of dyxin mRNA to 18S mRNA as determined by Northern blot analysis.
Figure 3. The effect of Ang II administration (33 μg/kg/h) on left ventricular BNP mRNA levels in rats (A). ***p<0.00l, **p<0.0l vs vehicle (Student's t-test). White columns, vehicle; black columns, Ang II. The effect of Ang II and AT1-receptor blockade by losartan (Los) on left ventricular BNP mRNA levels at 6 h (B). Results are mean±SEM (n=6–7). ***p<0.00l vs vehicle, †††p<0.001 vs Angll (ANOVA). The effect of Ang II and p38 MAPK inhibitor SB203580 on left ventricular BNP mRNA levels (C) at 6 h. Results are mean±SEM (n=4–7). ***p<0.00l vs vehicle. ††p<0.0l vs Ang II (ANOVA). All mRNA results are expressed as a ratio of BNP mRNA to 18S mRNA as determined by Northern blot analysis. The effect of Ang II administration (33 μg/kg/h) on the activation of p38 MAPK in rats (D). Western blot analysis showing total-p38 and phospho-p38 protein levels in the rat left ventricles. Results are mean±SEM (n=3–4). **p<0.0l vs vehicle (Student's t-test). White columns, vehicle; black columns, phospho-p38/total-p38.
Figure 4. The effect of myocardial infarction on left ventricular dyxin mRNA levels (A). Results (mean±SEM, n=5–8) are expressed as a ratio of dyxin mRNA to 18S mRNA as studied by real-time quantitative RT-PCR. The effect of myocardial infarction on left ventricular dyxin protein levels (B) as studied by Western blot. Results are mean±SEM (n=7). White columns, sham-operated; black columns, myocardial infarction. **p<0.0l, *p<0.05 vs sham-operated animals (Student's t-test).
Figure 5. The effect of Stretch on left ventricular dyxin mRNA levels using ex vivo Langendorff method (A). Results (mean±SEM, n=6) are expressed as a ratio of dyxin mRNA to 18S mRNA as determined by Northern blot analysis. **p<0.0l vs control (Student's t-test). Dyxin mRNA levels after mechanical Stretch in vitro in neonatal rat ventricular myocytes. Experiments were carried out in two separate sets each having their own controls: (i) 1, 4 and 12 h, and (ii) 24 and 48 h of Stretch (B). Results are mean±SEM (n=8). Dyxin mRNA levels after mechanical Stretch in vitro in neonatal rat ventricular myocytes as studied by real-time quantitative RT-PCR (C). Results are mean±SEM (n=6) and expressed as a ratio of dyxin mRNA to 18S mRNA. White columns, control; black columns, Stretch. ***p<0.001, **p<0.01, *p<0.05 vs control (Student's t-test).