Figures & data
Figure 1. Flow diagram of participating nurses.
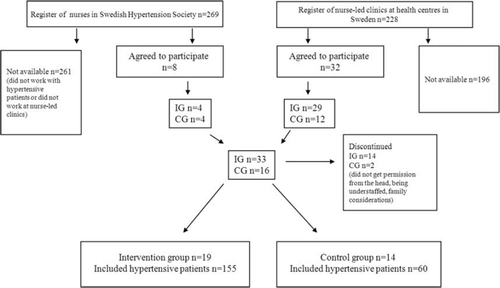
Figure 2. Flow diagram of patients. aData missing due to patients not showing up or the nurses being off duty when data should be collected.
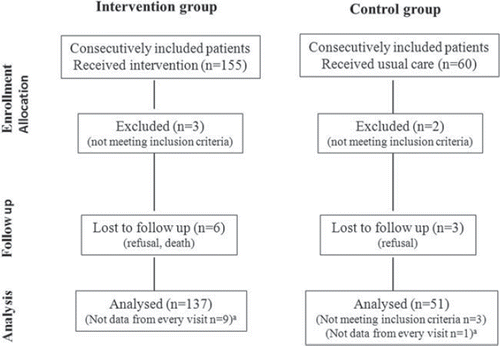
Table I. Overview of blood pressure (BP), heart rate, body mass index (BMI), weight, waist, waist-hip ratio (WHR) and blood lipids at baseline and significance level within groups after 2 years.
Table II. Data from baseline to the 2-year follow-up for blood pressure (BP), blood lipids, waist, waist–hip ratio (WHR) and body mass index (BMI).
Table III. Antihypertensive and lipid-lowering drug medication (proportion of patients).