383
Views
8
CrossRef citations to date
0
Altmetric
Original Article

Left ventricular diastolic dysfunction in newly diagnosed untreated hypertensive patients

, , , , , , , & show all
Pages 331-337 | Received 09 Jan 2012, Accepted 29 Mar 2012, Published online: 21 May 2012

Figures & data

Table I. Characteristics of control subjects and hypertensive patients (HT) without or with diastolic dysfunction (DD).

Table II. Echocardiographic data in normotensive controls and in hypertensive patients without or with diastolic dysfunction.

Figure 1. Behaviour of deceleration time of E velocity (DT), isovolumic relaxation time (IVRT), endocardial fractional shortening (EFS), systodiastolic ratio (S/D), peak pulmonary vein systolic (PVs), diastolic (PVd) and average (PVa) velocity values and filling time in normotensive subjects (C, open bars) and in age-matched essential untreated and newly diagnosed hypertensive patients without (HT, grey bars) and with (HTD, black bars) left ventricular diastolic dysfunction. Data are shown as means ± SEM. Asterisks (*p < 0.05, **p < 0.01) refer to the statistical significance between groups.
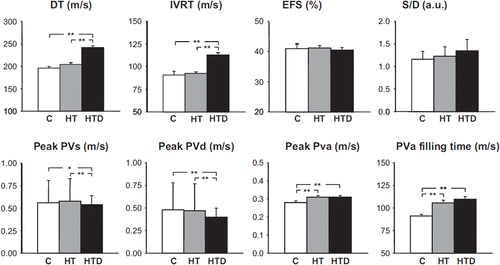
Figure 1. Behaviour of deceleration time of E velocity (DT), isovolumic relaxation time (IVRT), endocardial fractional shortening (EFS), systodiastolic ratio (S/D), peak pulmonary vein systolic (PVs), diastolic (PVd) and average (PVa) velocity values and filling time in normotensive subjects (C, open bars) and in age-matched essential untreated and newly diagnosed hypertensive patients without (HT, grey bars) and with (HTD, black bars) left ventricular diastolic dysfunction. Data are shown as means ± SEM. Asterisks (*p < 0.05, **p < 0.01) refer to the statistical significance between groups.
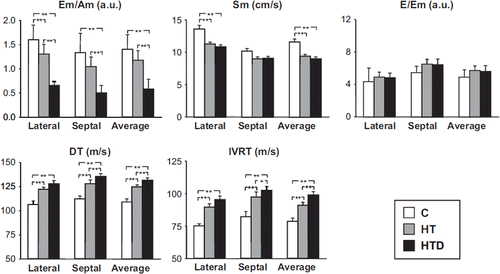
Figure 2. Behaviour of deceleration time of Em/Am ratio, myocardial systolic peak velocity (Sm), E/Em ratio, deceleration time of E velocity (DT), isovolumic relaxation time (IVRT) in normoresive subjects (C, open bars) and in age-matched essential untreated and newly diagnosed hypertensive patients without (HT, grey bars) and with (HTD, black bars) left ventricular diastolic dysfunction. Data are related to the lateral and septal mitral annulus or averaged together Data are shown as means ± SEM. Asterisks (*p < 0.05, **p < 0.01) refer to the statistical significance between groups.

Figure 2. Behaviour of deceleration time of Em/Am ratio, myocardial systolic peak velocity (Sm), E/Em ratio, deceleration time of E velocity (DT), isovolumic relaxation time (IVRT) in normoresive subjects (C, open bars) and in age-matched essential untreated and newly diagnosed hypertensive patients without (HT, grey bars) and with (HTD, black bars) left ventricular diastolic dysfunction. Data are related to the lateral and septal mitral annulus or averaged together Data are shown as means ± SEM. Asterisks (*p < 0.05, **p < 0.01) refer to the statistical significance between groups.

Table III. Person's correlation between E/A and E’/A’ with clinical variables.

Table IV. Linear regression models – stepwise selection.

Reprints and Corporate Permissions

Please note: Selecting permissions does not provide access to the full text of the article, please see our help page How do I view content?

To request a reprint or corporate permissions for this article, please click on the relevant link below:

Academic Permissions

Please note: Selecting permissions does not provide access to the full text of the article, please see our help page How do I view content?

Obtain permissions instantly via Rightslink by clicking on the button below:

If you are unable to obtain permissions via Rightslink, please complete and submit this Permissions form. For more information, please visit our Permissions help page.