Figures & data
Table I. The inclusion and exclusion criteria for study.
Figure 1. The pressure curves obtained from the ascending aorta (P1) and the femoral artery (P2) (t, transit time).
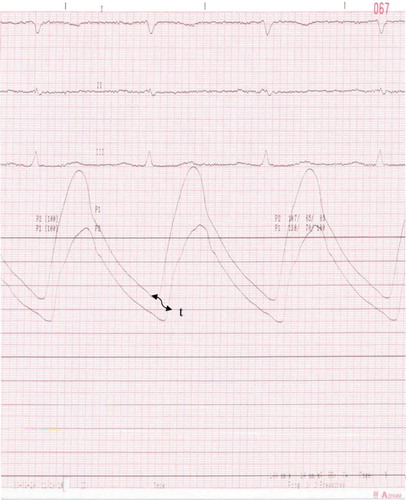
Table II. Clinical characteristics of patients.
Table III. Comparison of hemodynamic parameters in the groups with and without coronary artery disease (CAD).
Table IV. Correlation analysis of aortic pulse wave velocity (PWV) with age, the presence of coronary artery disease (CAD) and hemodynamic parameters.