Figures & data
Figure 1. The calculation of tissue Doppler-derived left ventricle myocardial performance index (ICT, isovolumic contraction time; ET, ejection time; IRT, isovolumic relaxation time).
![Figure 1. The calculation of tissue Doppler-derived left ventricle myocardial performance index (ICT, isovolumic contraction time; ET, ejection time; IRT, isovolumic relaxation time).](/cms/asset/30b67ddf-450a-4d8d-94b1-82505aa581af/iblo_a_778006_f0001_b.jpg)
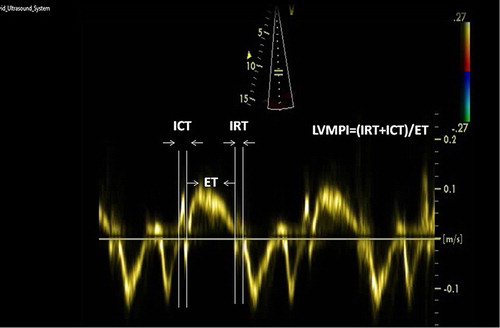
Table I. Comparisons of baseline characteristics among the groups.
Table II. Comparisons of echocardiographic characteristics among the groups.
Figure 2. Relationship between tissue Doppler-derived left ventricle myocardial performance index and left ventricle mass index.
![Figure 2. Relationship between tissue Doppler-derived left ventricle myocardial performance index and left ventricle mass index.](/cms/asset/54b50b73-efb9-4766-9fe7-226bbdcfe07a/iblo_a_778006_f0002_b.gif)
Figure 3. Relationship between tissue Doppler-derived left ventricle myocardial performance index and aortic distensibility.
![Figure 3. Relationship between tissue Doppler-derived left ventricle myocardial performance index and aortic distensibility.](/cms/asset/8c9afed4-1057-4ae4-974f-170f0e584c87/iblo_a_778006_f0003_b.gif)
Table III. Correlation analysis of variables in patient group.