
Figures & data
Table I. General characteristics of normotensive, mild to moderate hypertensive and resistant hypertensive subjects.
Table II. Biochemical parameters of normotensive, mild to moderate hypertensive and resistant hypertensive subjects.
Figure 1. Frequency of patients according interleukin 1β (IL-1β) and interleukin 10 (IL-10) levels in normotensive, mild to moderate hypertensive and resistant hypertensive subjects (chi-square test: p = 0.0002 and p < 0.0001, respectively). NT, normotensive; HTN, mild to moderate hypertension; RHTN, resistant hypertension.
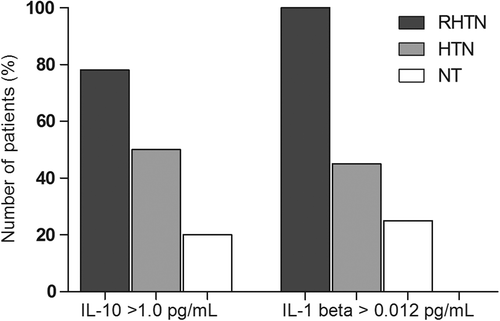
Figure 2. Comparison between tumor necrosis factor- α (TNF-α) and interleukin 6 (IL-6) levels in normotensive, mild to moderate hypertensive and resistant hypertensive subjects. (mean (95% CI). NT, normotensive; HTN, mild to moderate hypertension; RHTN, resistant hypertension). p = 0.0018. *vs NT.
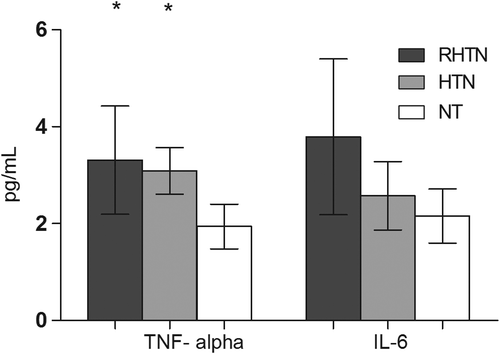
Figure 3. Arterial stiffness (pulse wave velocity, PWV) in normotensive (NT), mild to moderate hypertensive (HTN) and resistant hypertensive subjects (RHTN). p < 0.0001 *vs NT; #vs HTN.
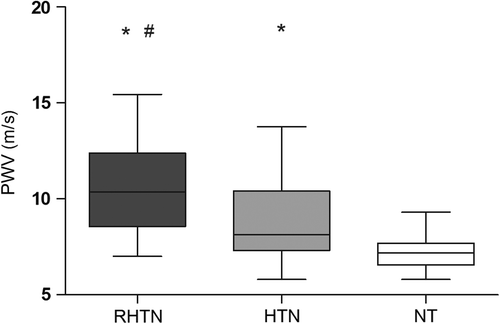
Table III. Multivariate linear regression analysis for the associations between inflammatory biomarkers [interleukin 1β (IL-1β), interleukin 10 (IL-10), tumor necrosis factor-α (TNF-α) and high-sensitivity C-reactive protein (hs-CRP)], and arterial stiffness of normotensive, mild to moderate hypertensive and resistant hypertensive subjects.