
Figures & data
Figure 1. Effects of a 3-month treatment with amlodipine or valsartan on sphygmomanometric systolic (S, upper panel) and diastolic (D, lower panel) blood pressure values. Data are shown as medians (25–75%).
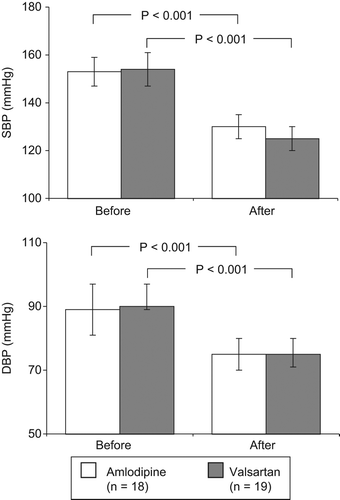
Table I. Baseline demographic, clinical and laboratory data of the study patients.
Figure 2. Effects of a 3-month treatment with amlodipine or valsartan on endocan circulating plasma levels (upper panel) and C-reactive protein (CRP, lower panel). Data are shown as medians (25–75%).
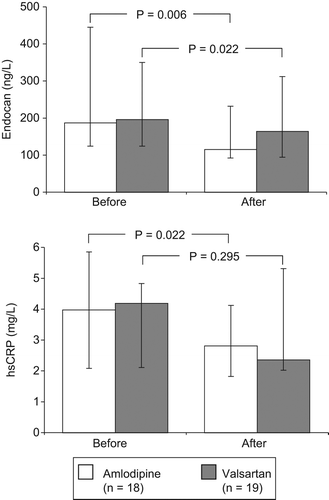
Table II. Correlations between percent change of endocan levels and corresponding blood pressure and C-reactive protein percent changes induced by treatment in the whole population sample of the study.